Acquisition: View Progress of Meeting Requests
The acquisition shows the engagement potential through requests for People and inquiries for Products and Companies. Bookmarks data provides a preliminary lens in growing the opportunities further.
Meeting Requests
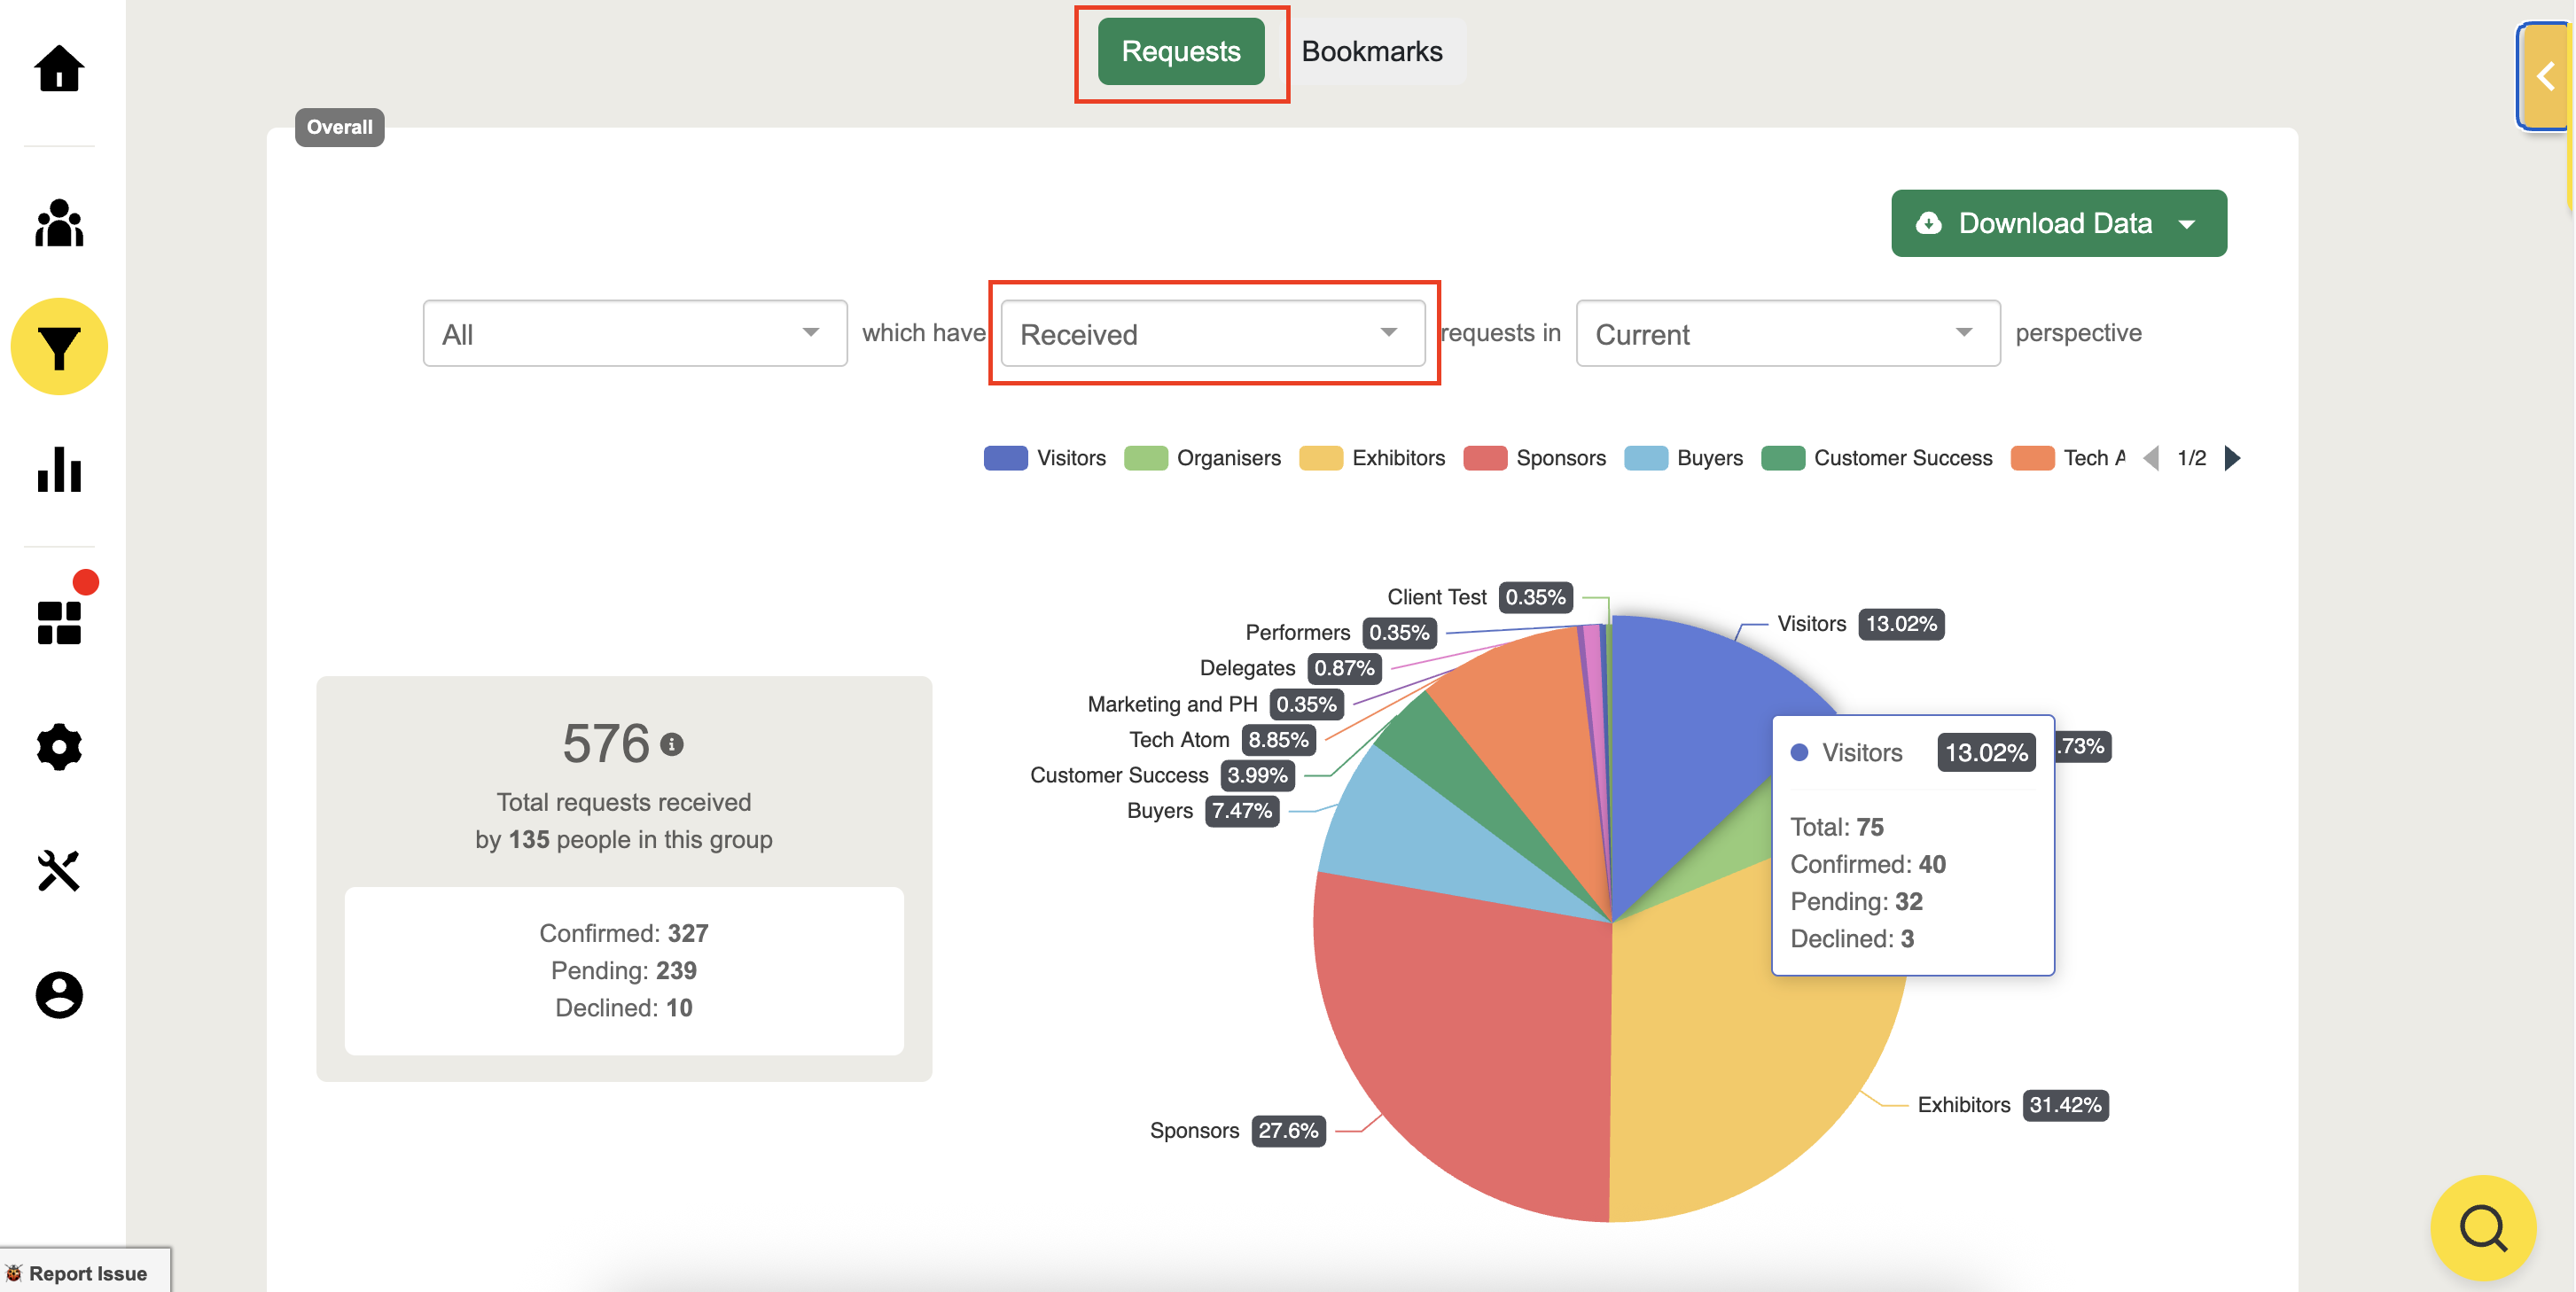
Received requests per group
Hover over the pie chart to view the number of:
Total requests received
Accepted & Declined requests
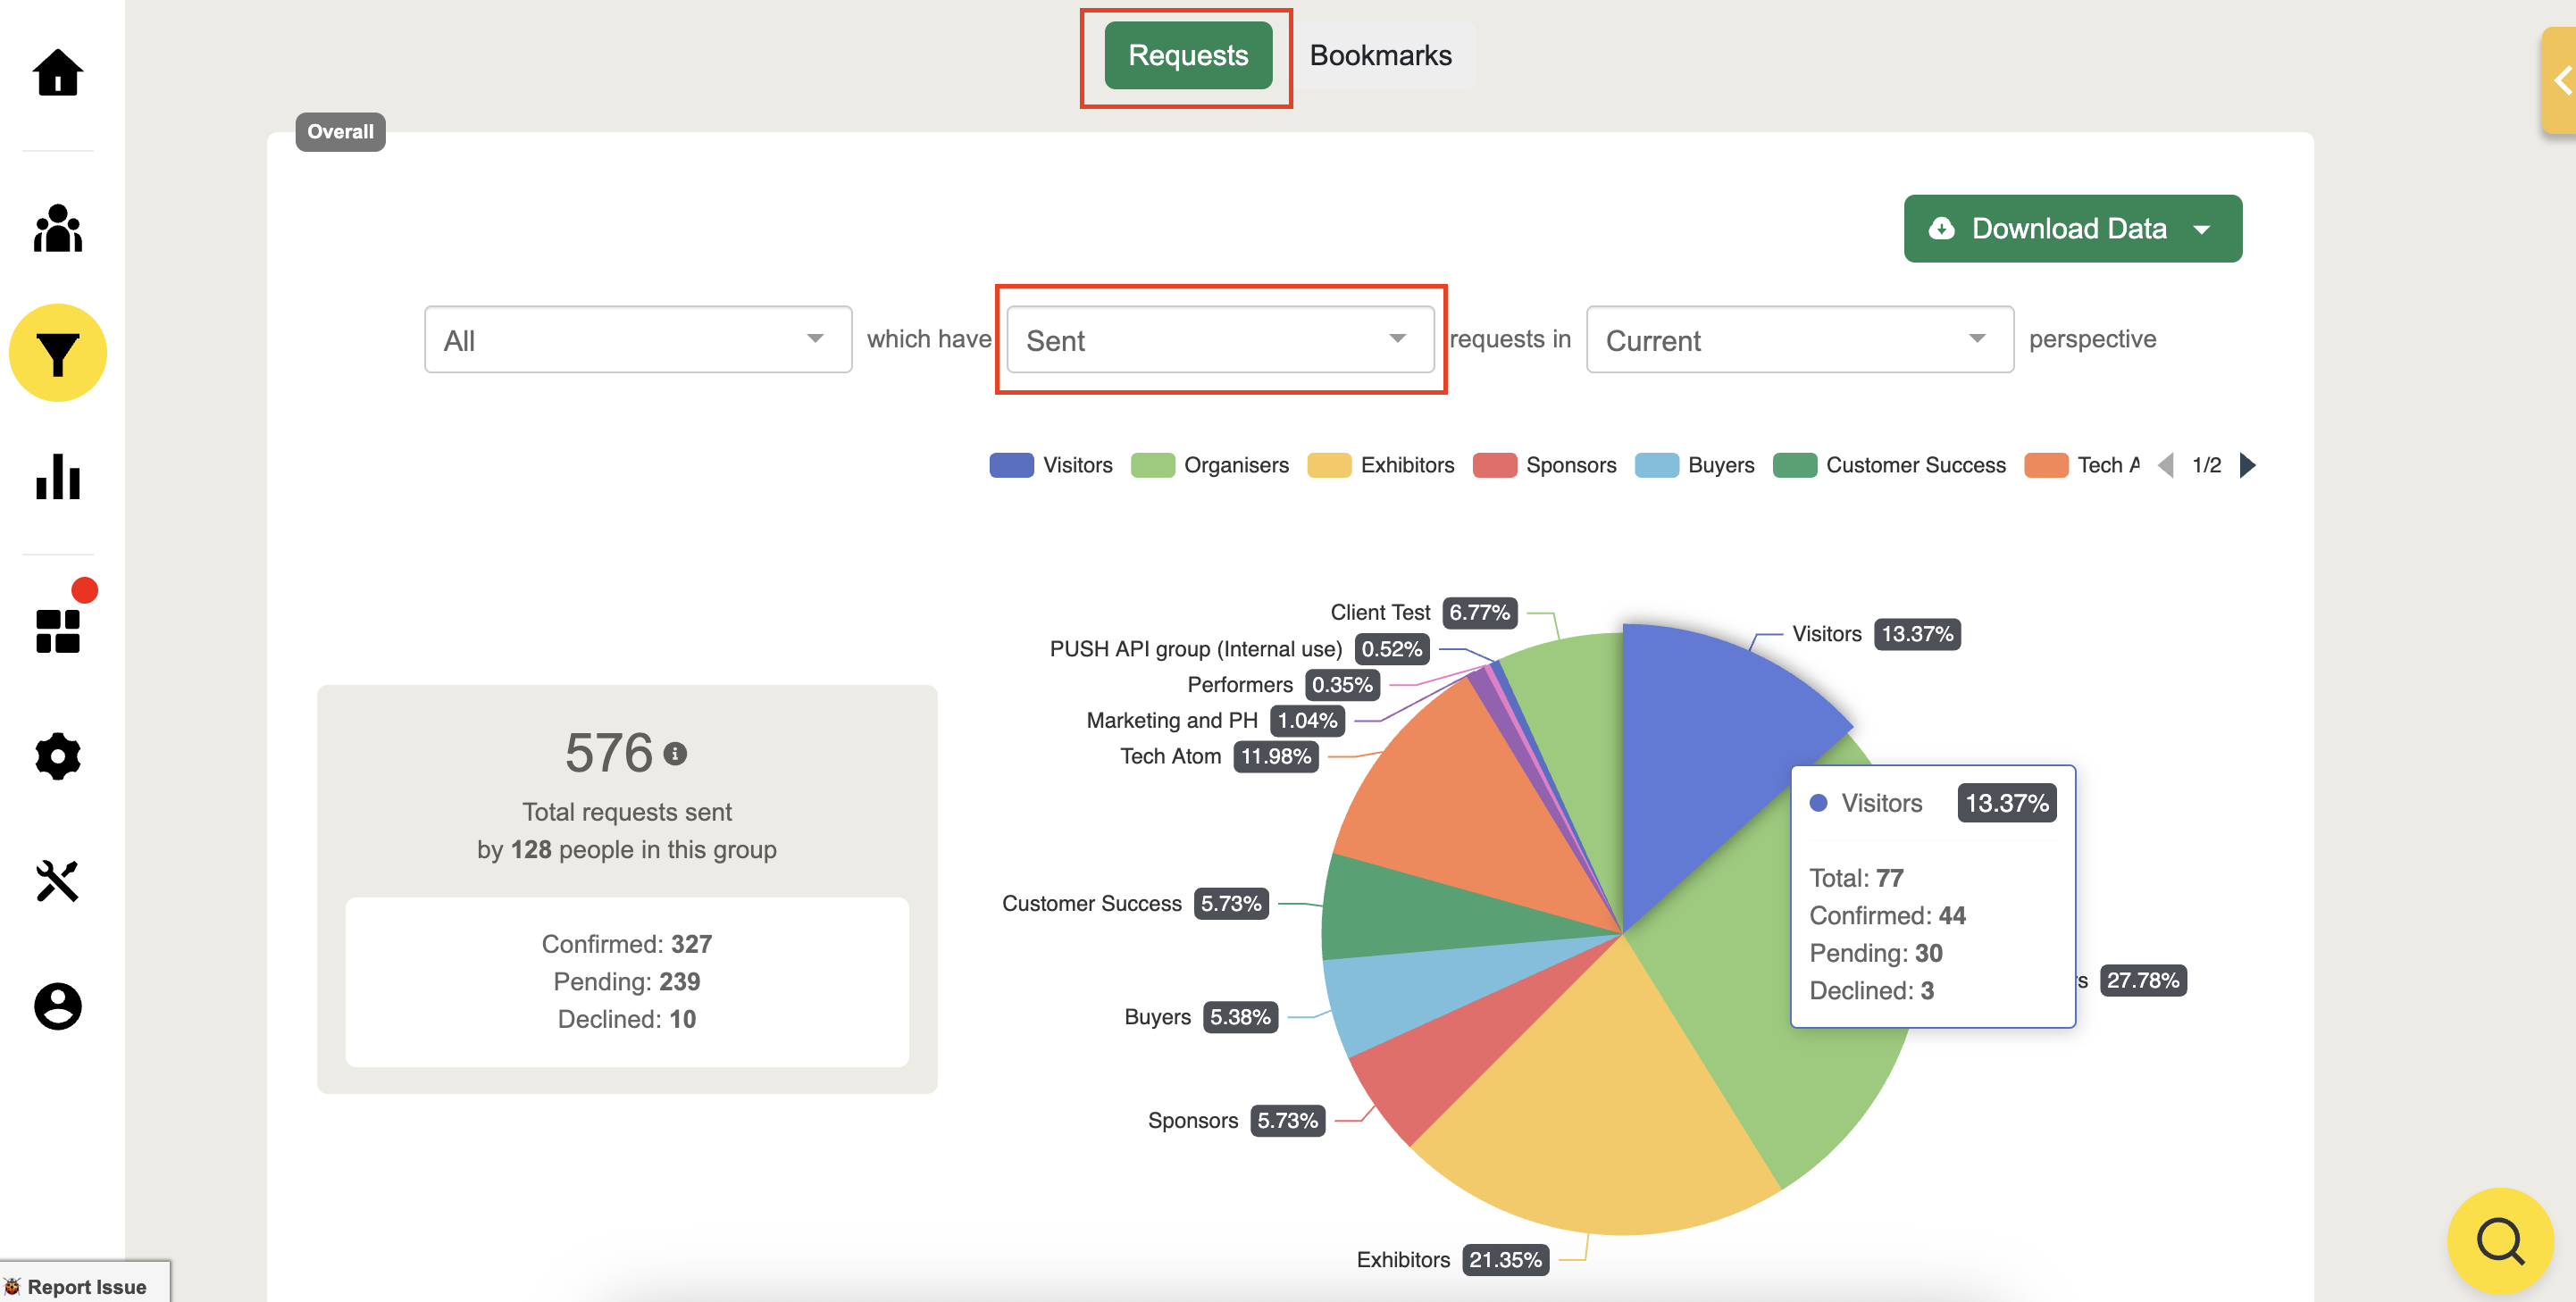
Sent requests per group
Hover over the pie chart to view the number of:
Total requests sent
Accepted & Declined requests
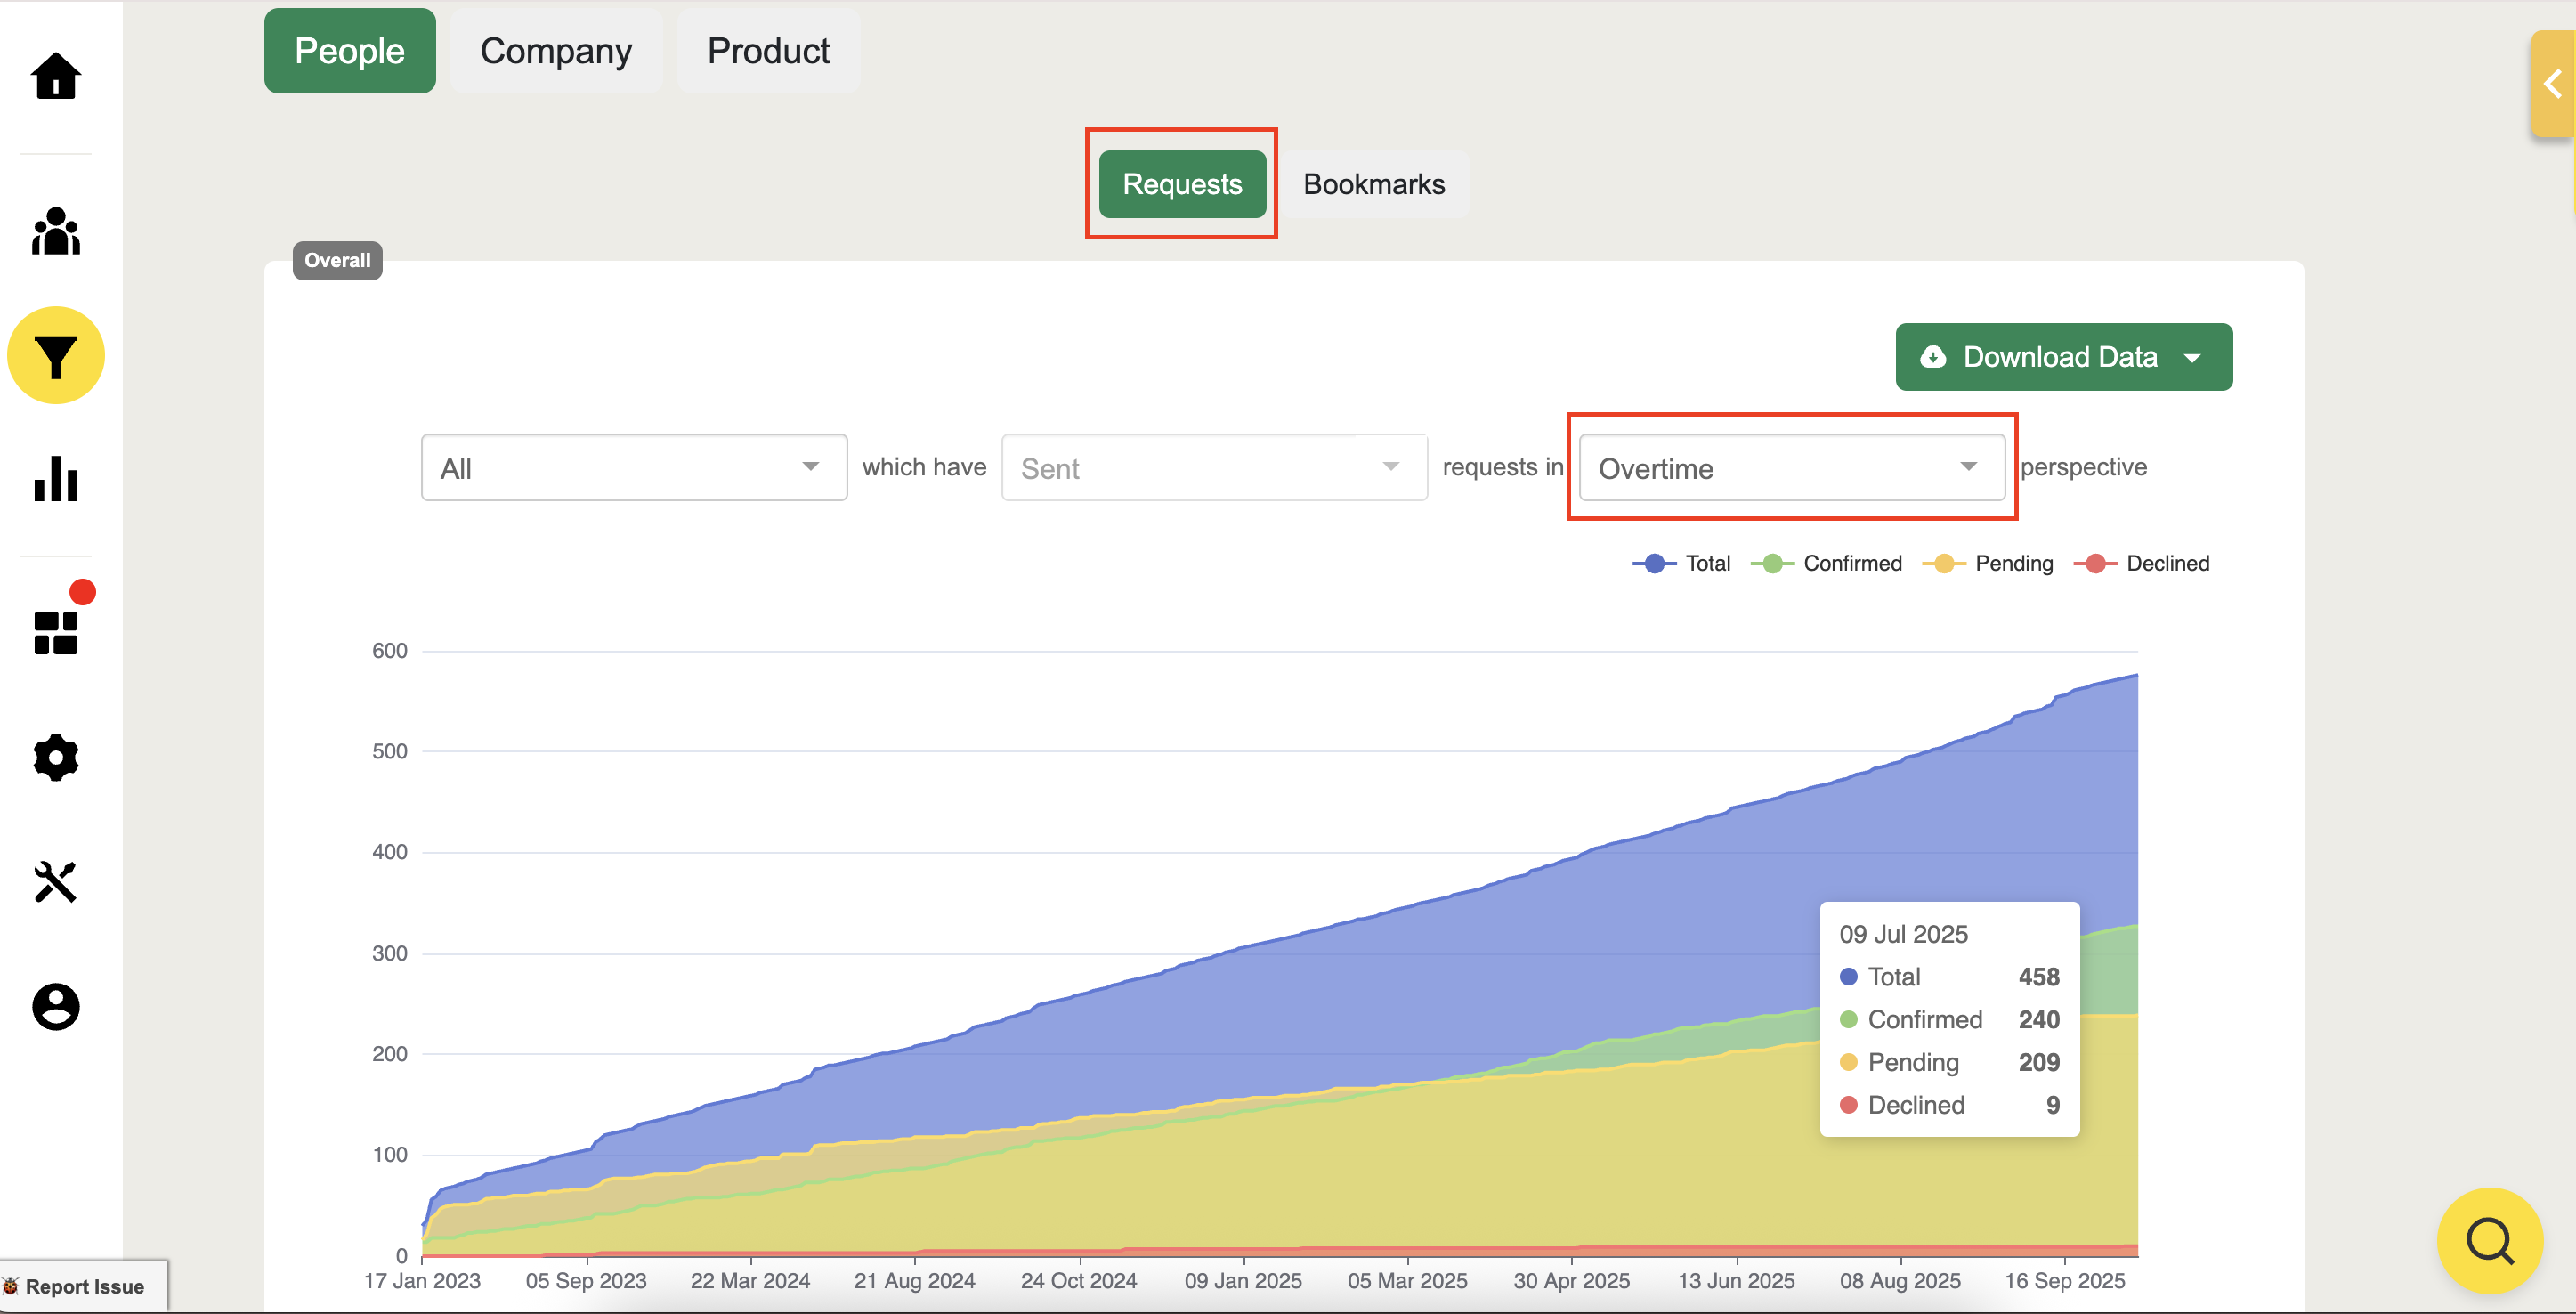
Click "Over time" to monitor the meeting trends
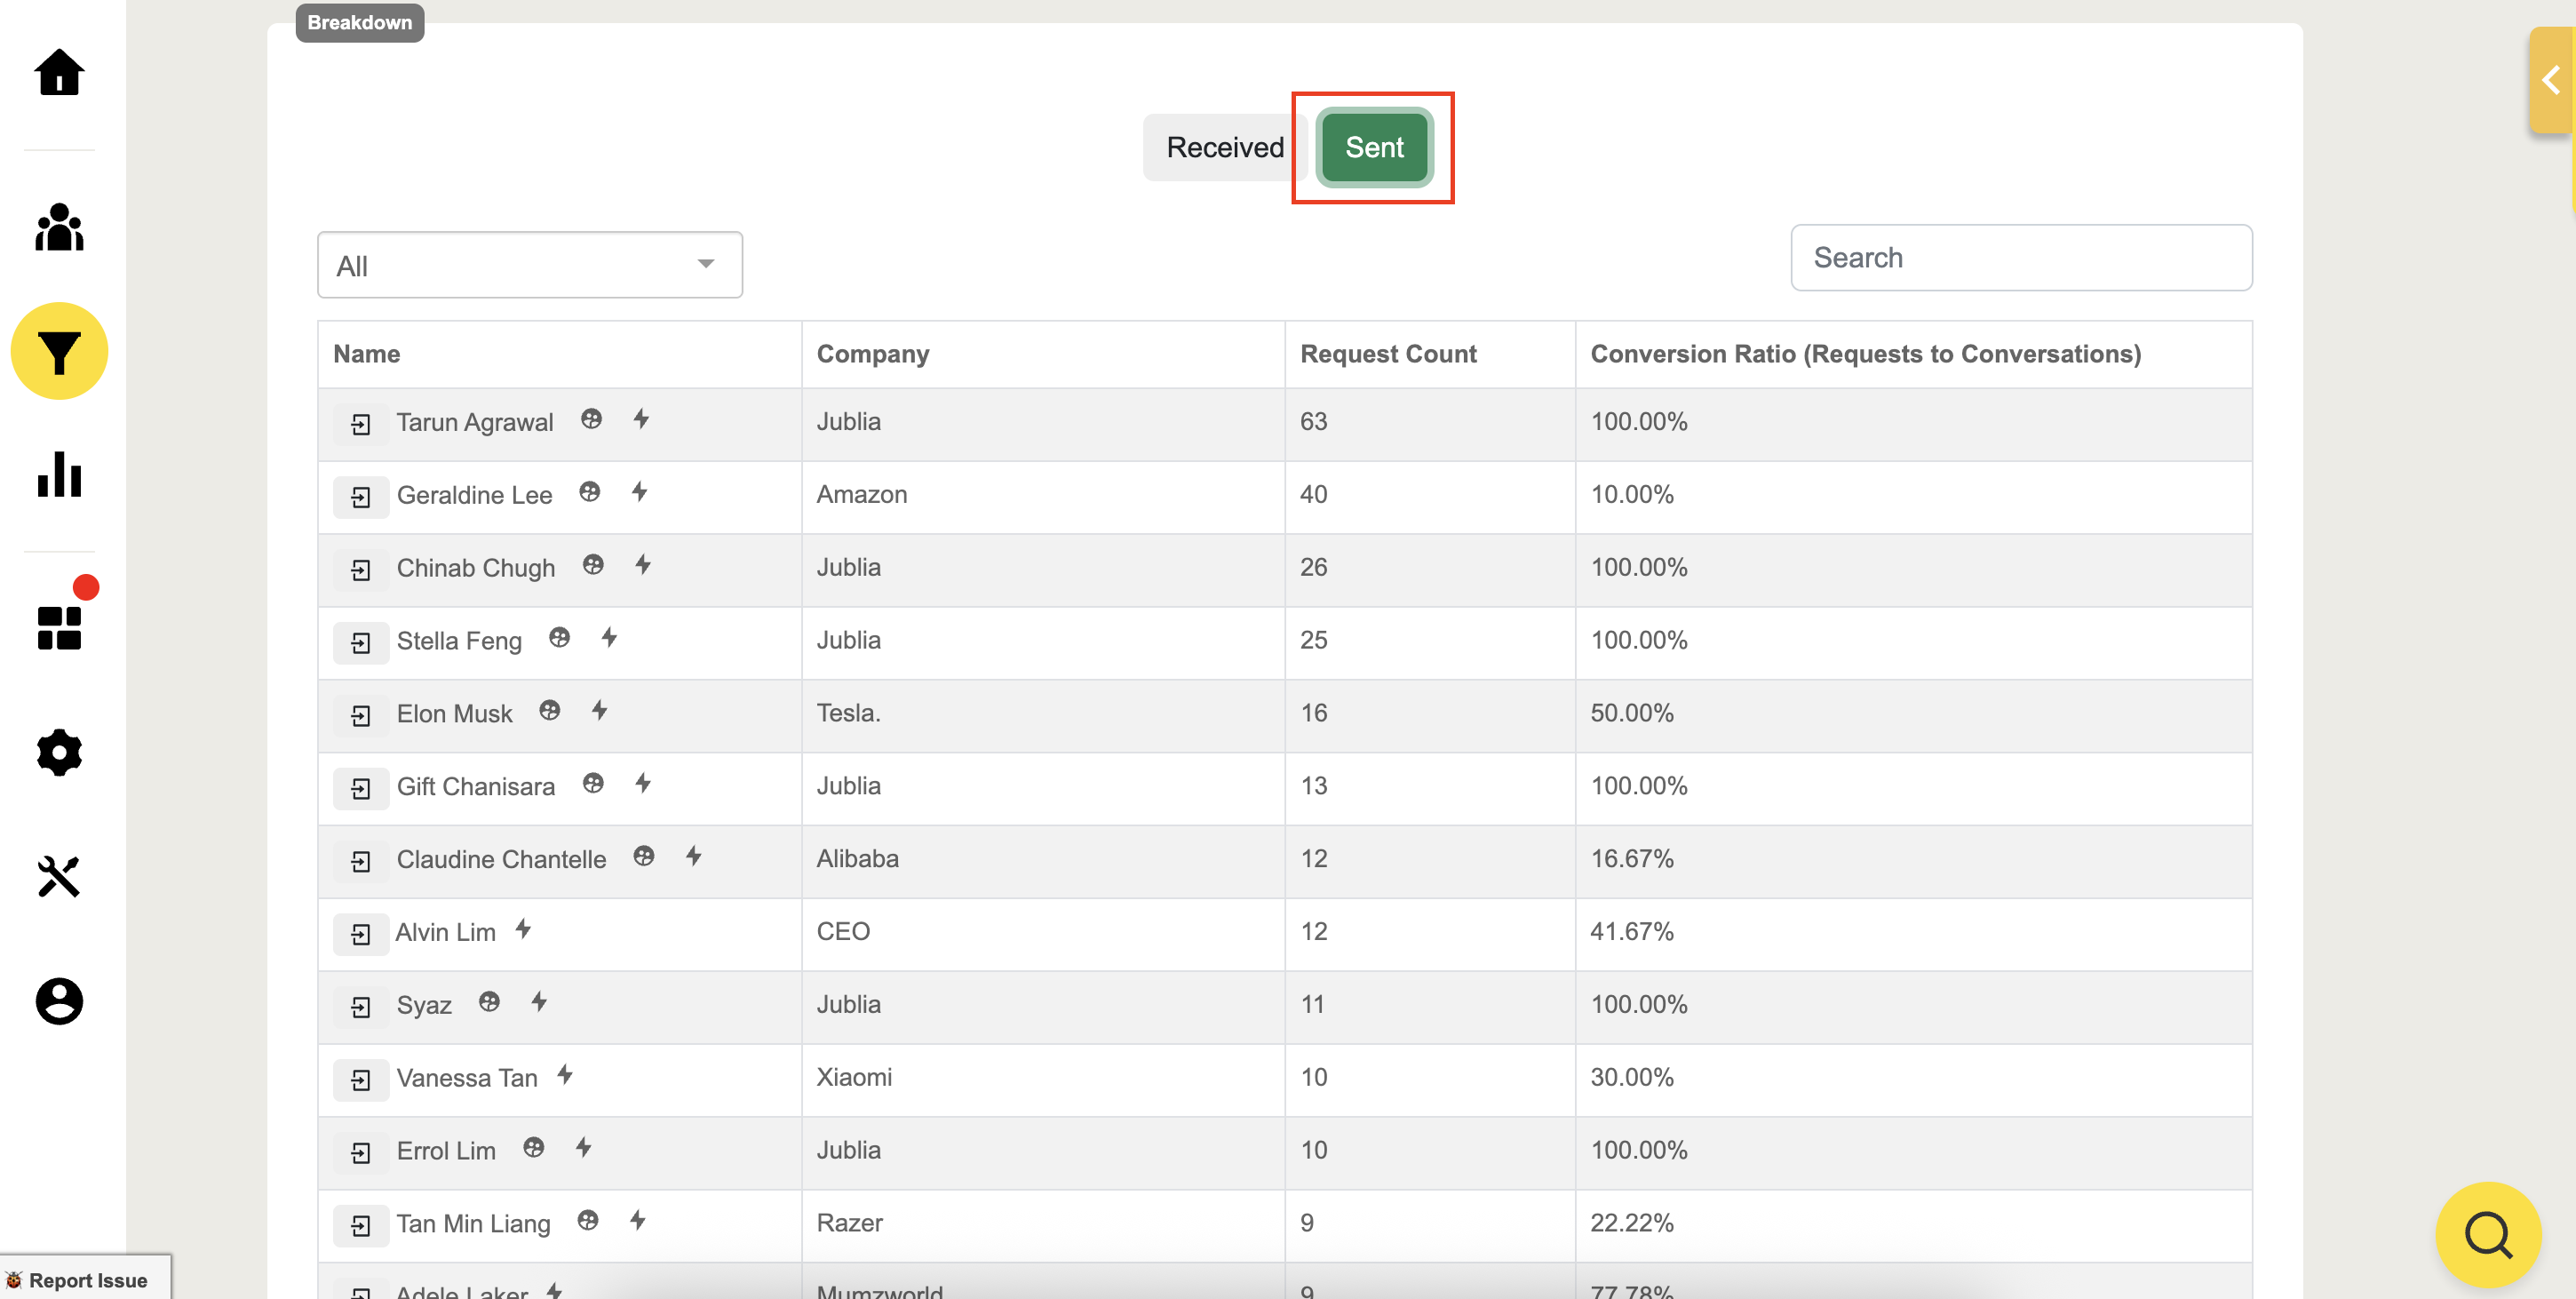
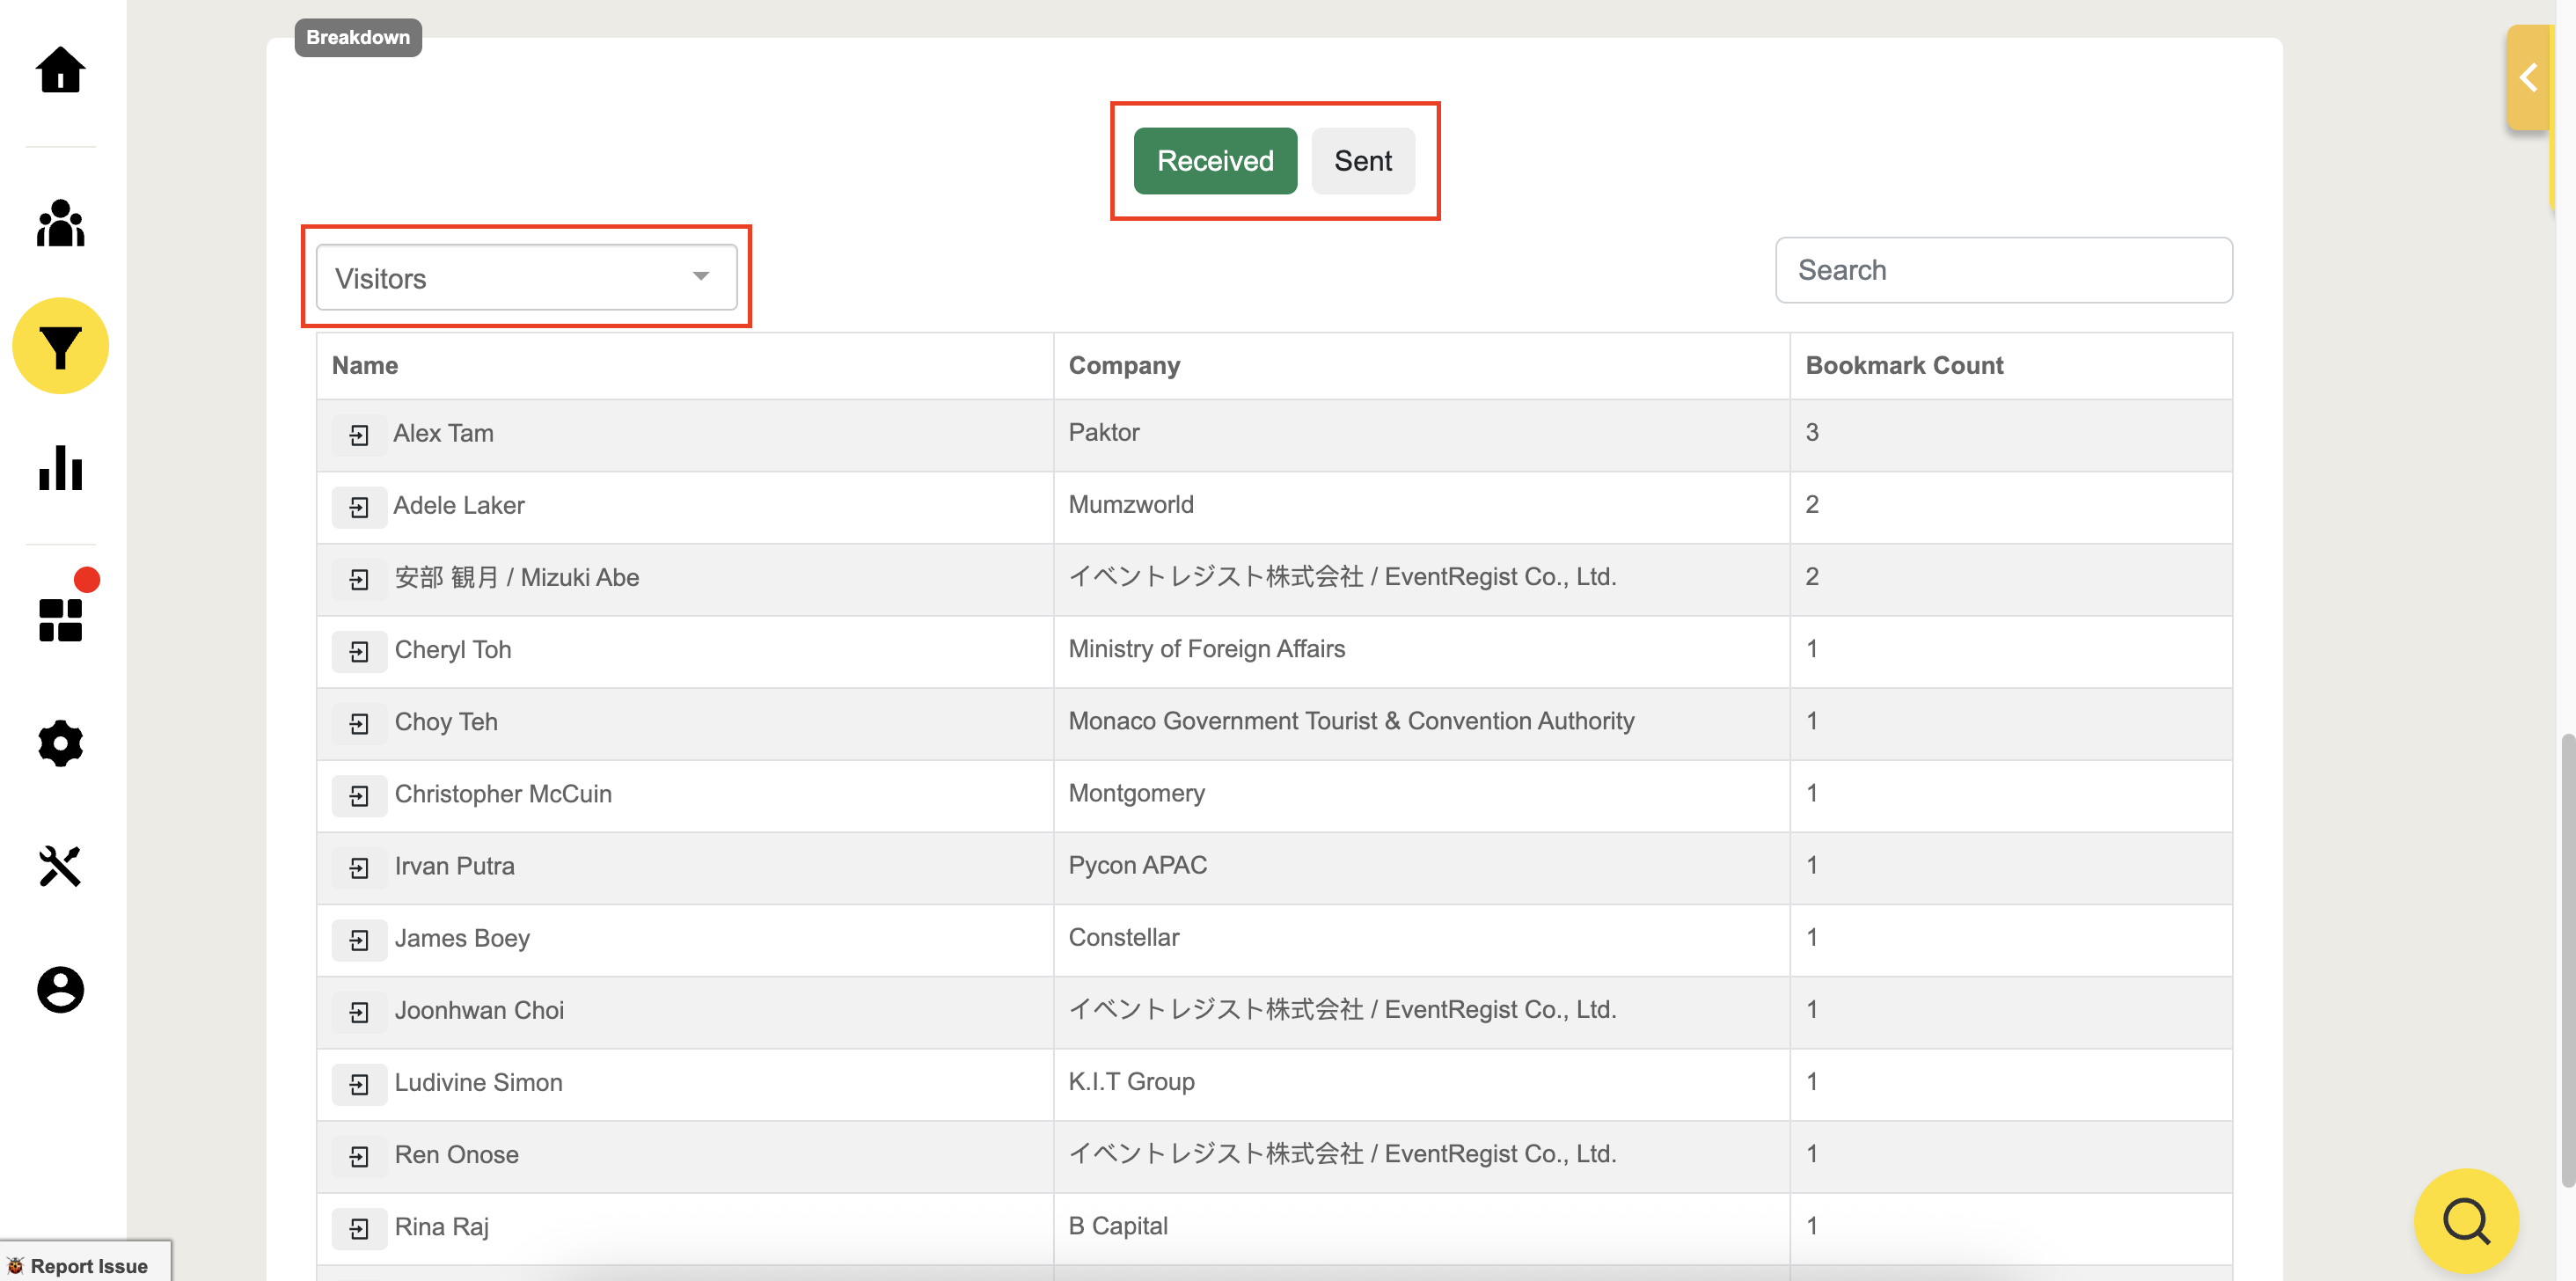
Scroll down to the Acquisition page and see the breakdown to filter and view the number of requests sent by attendees and the ratio of meeting requests that have been accepted as confirmed meetings or conversations.
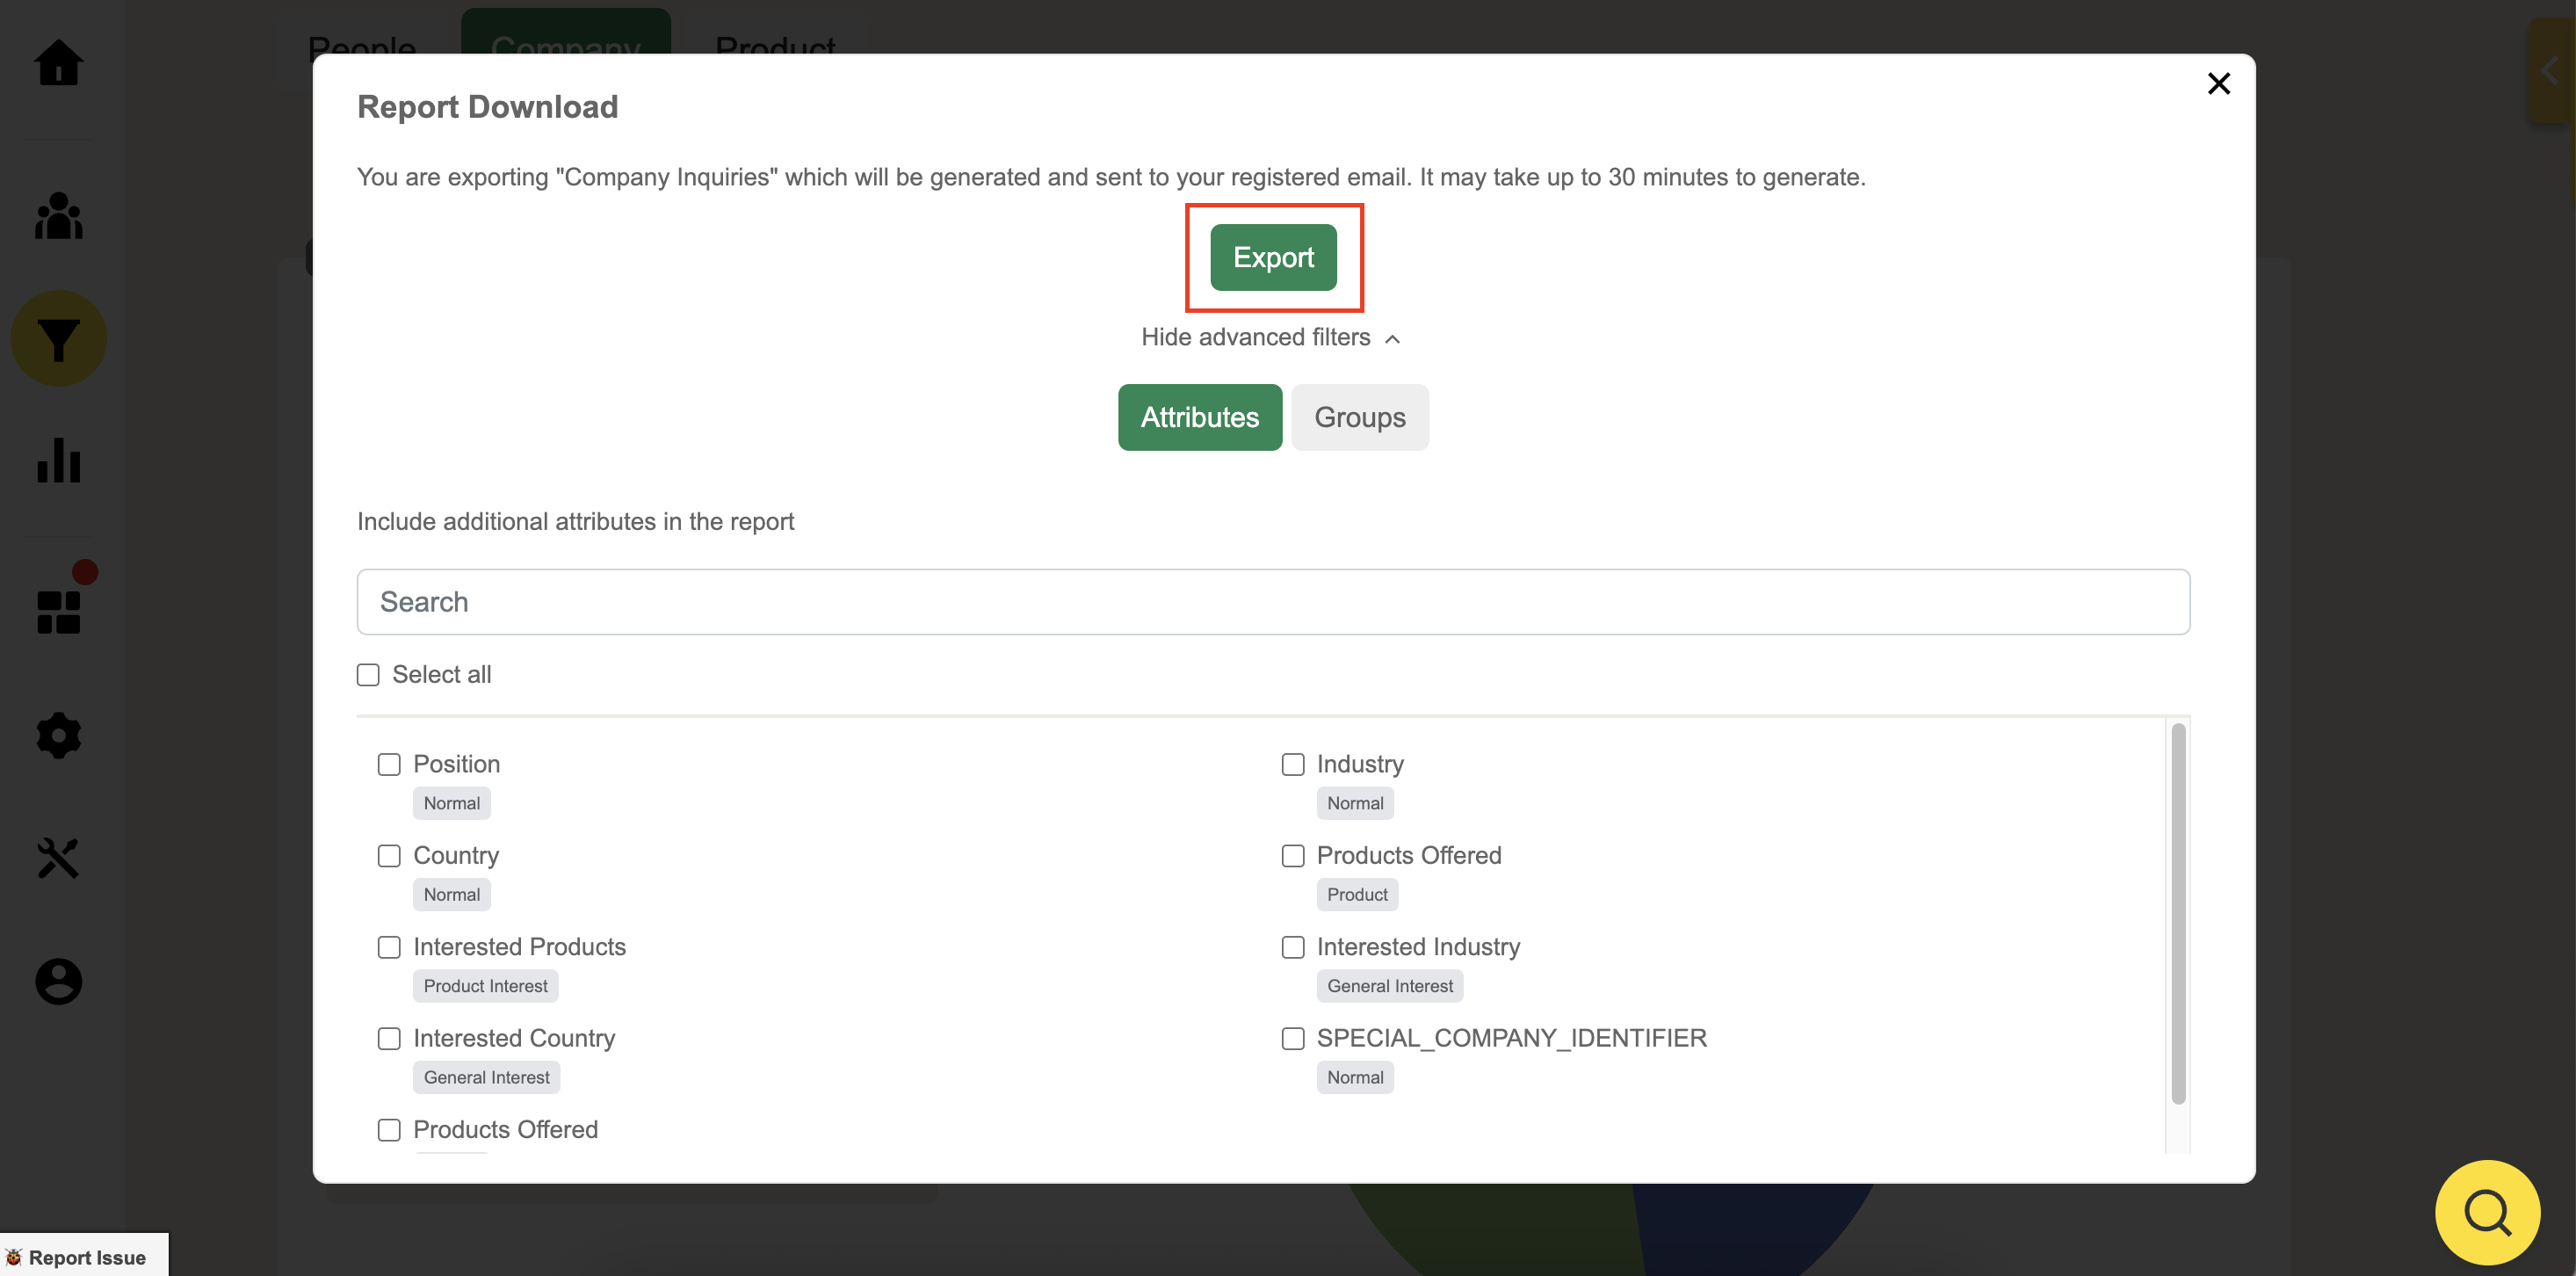
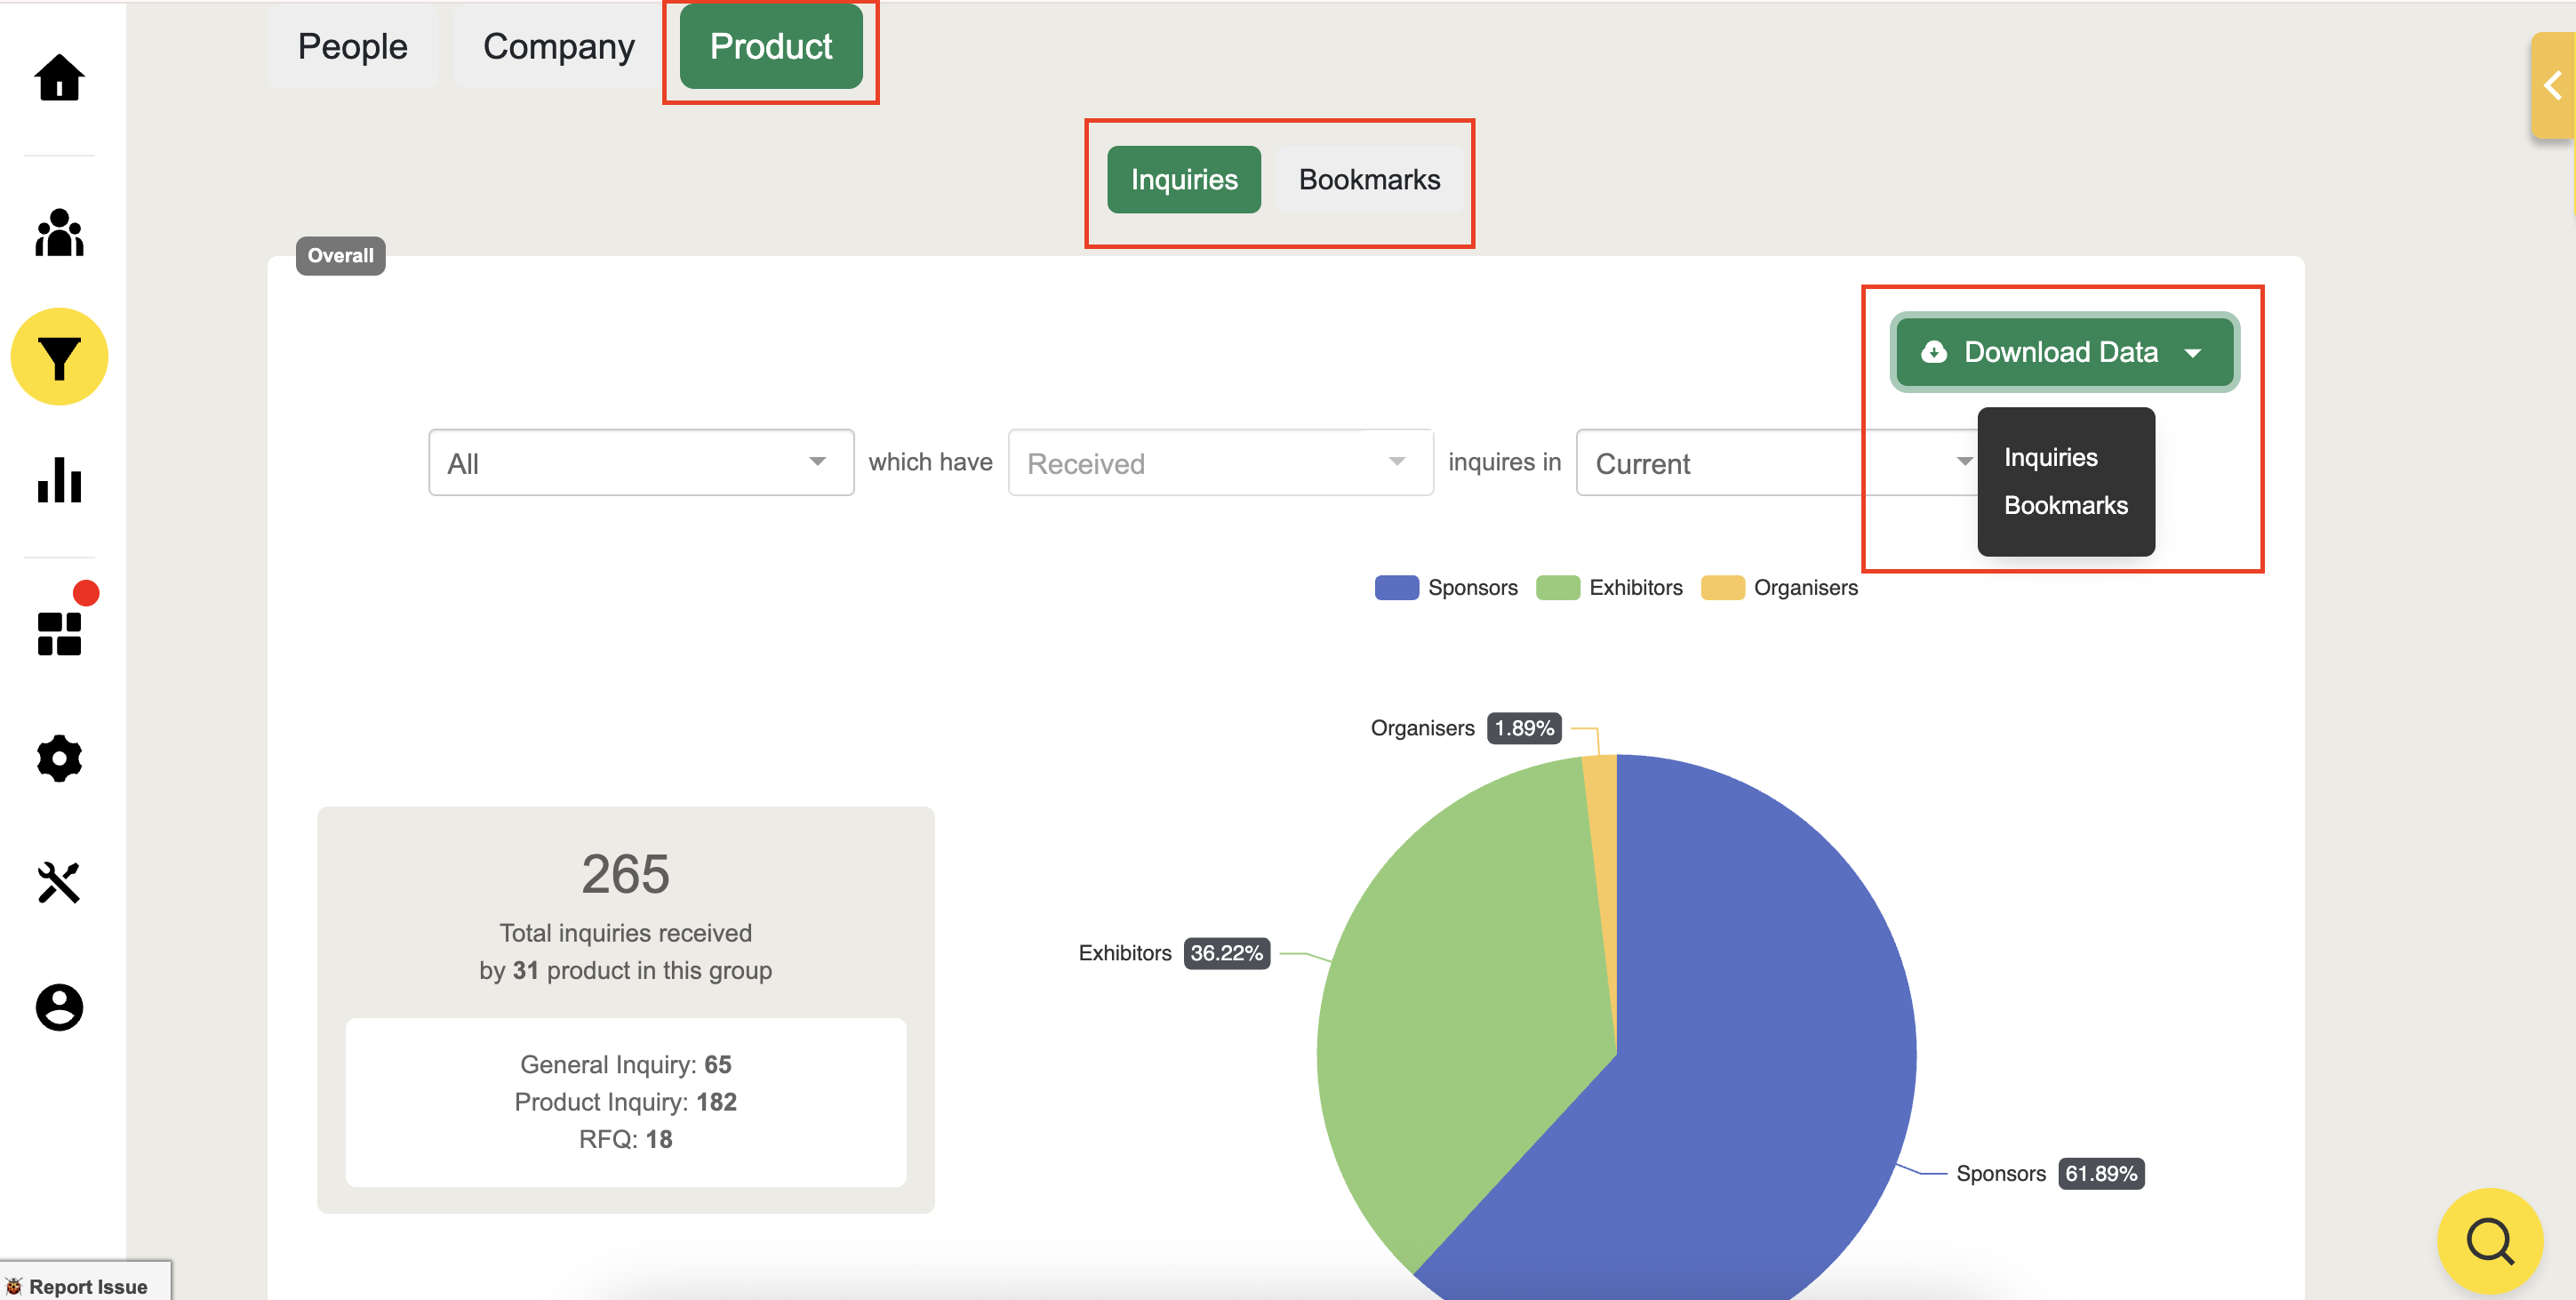
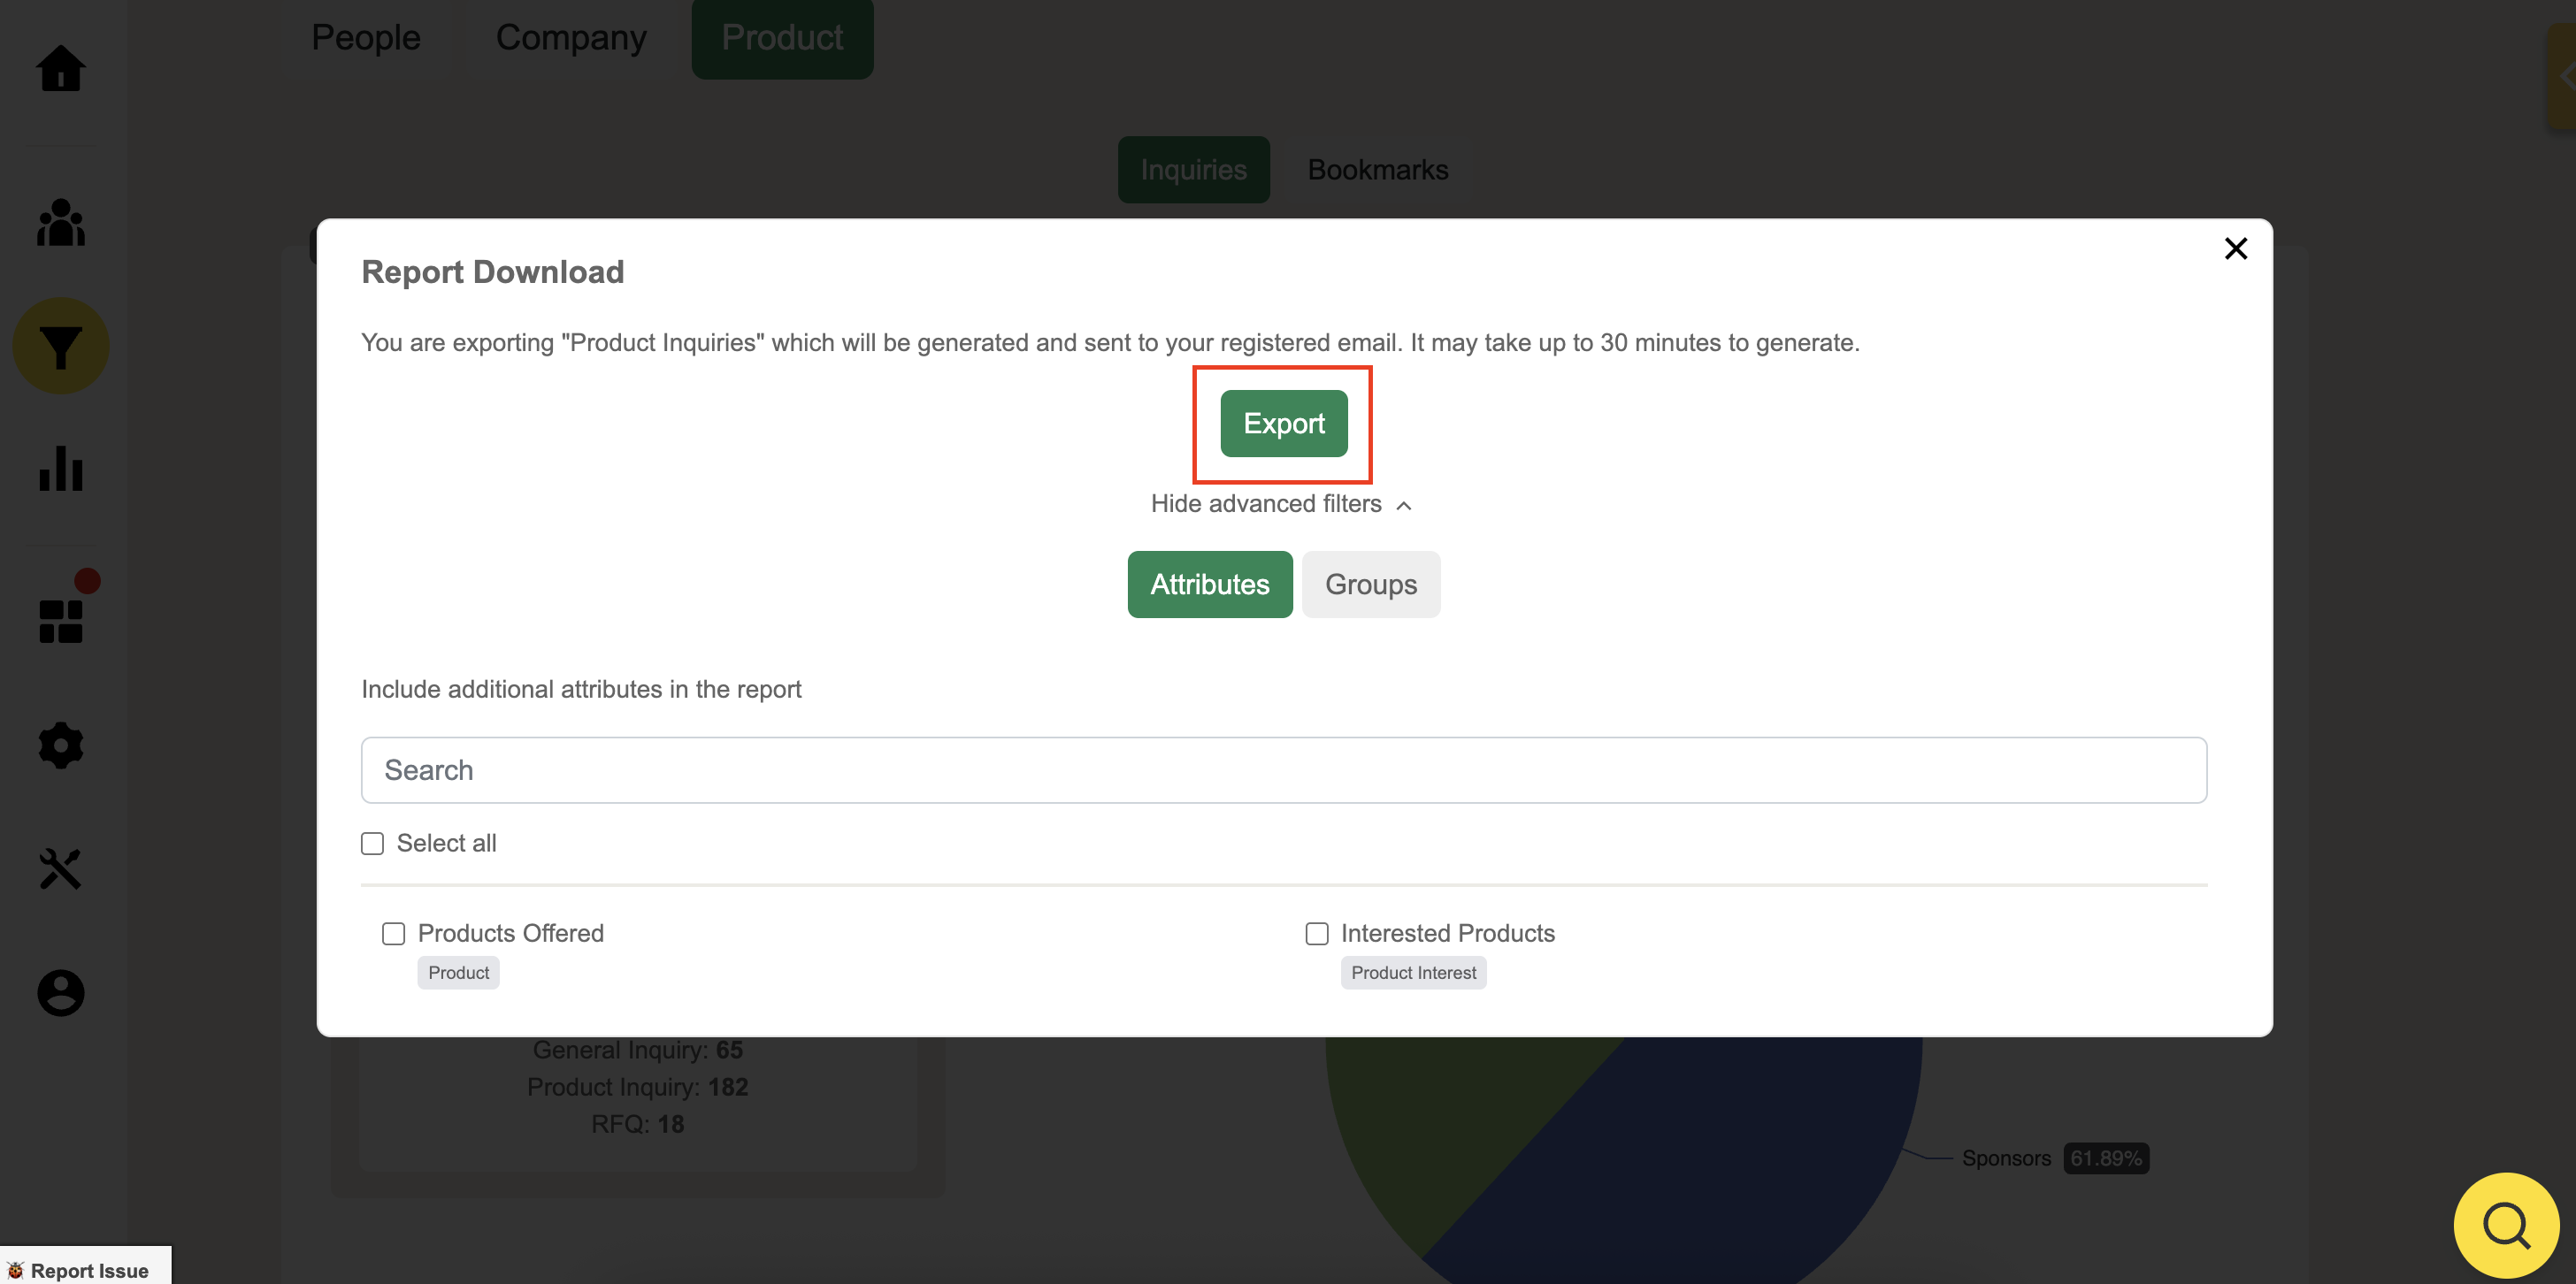
Download data by exporting to your email the Request and Bookmarks data.
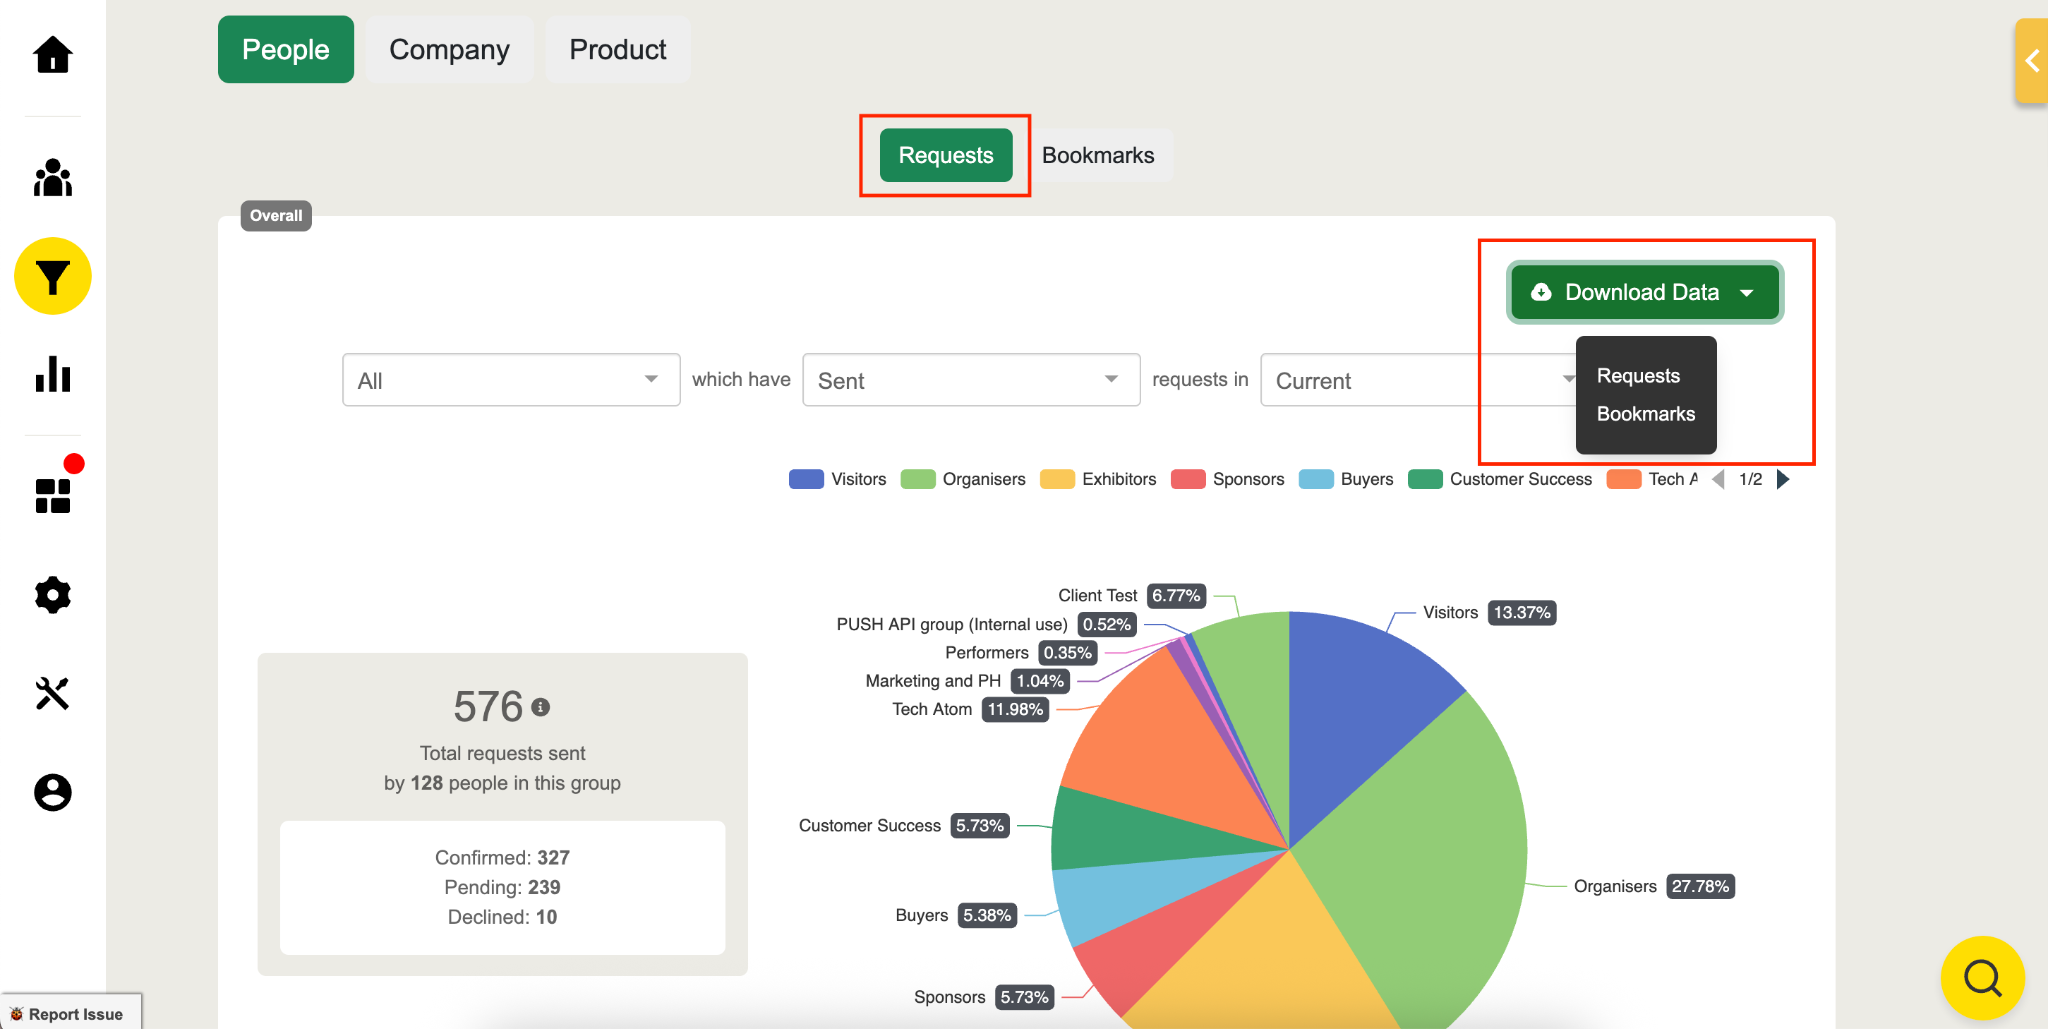
You can also filter your export by attribute and group to include advanced filters to maximize your report data
Bookmarks
Bookmark Sent / Received
Hover over the pie chart to view the number of:
Total bookmarks made
Sent & Received bookmarks
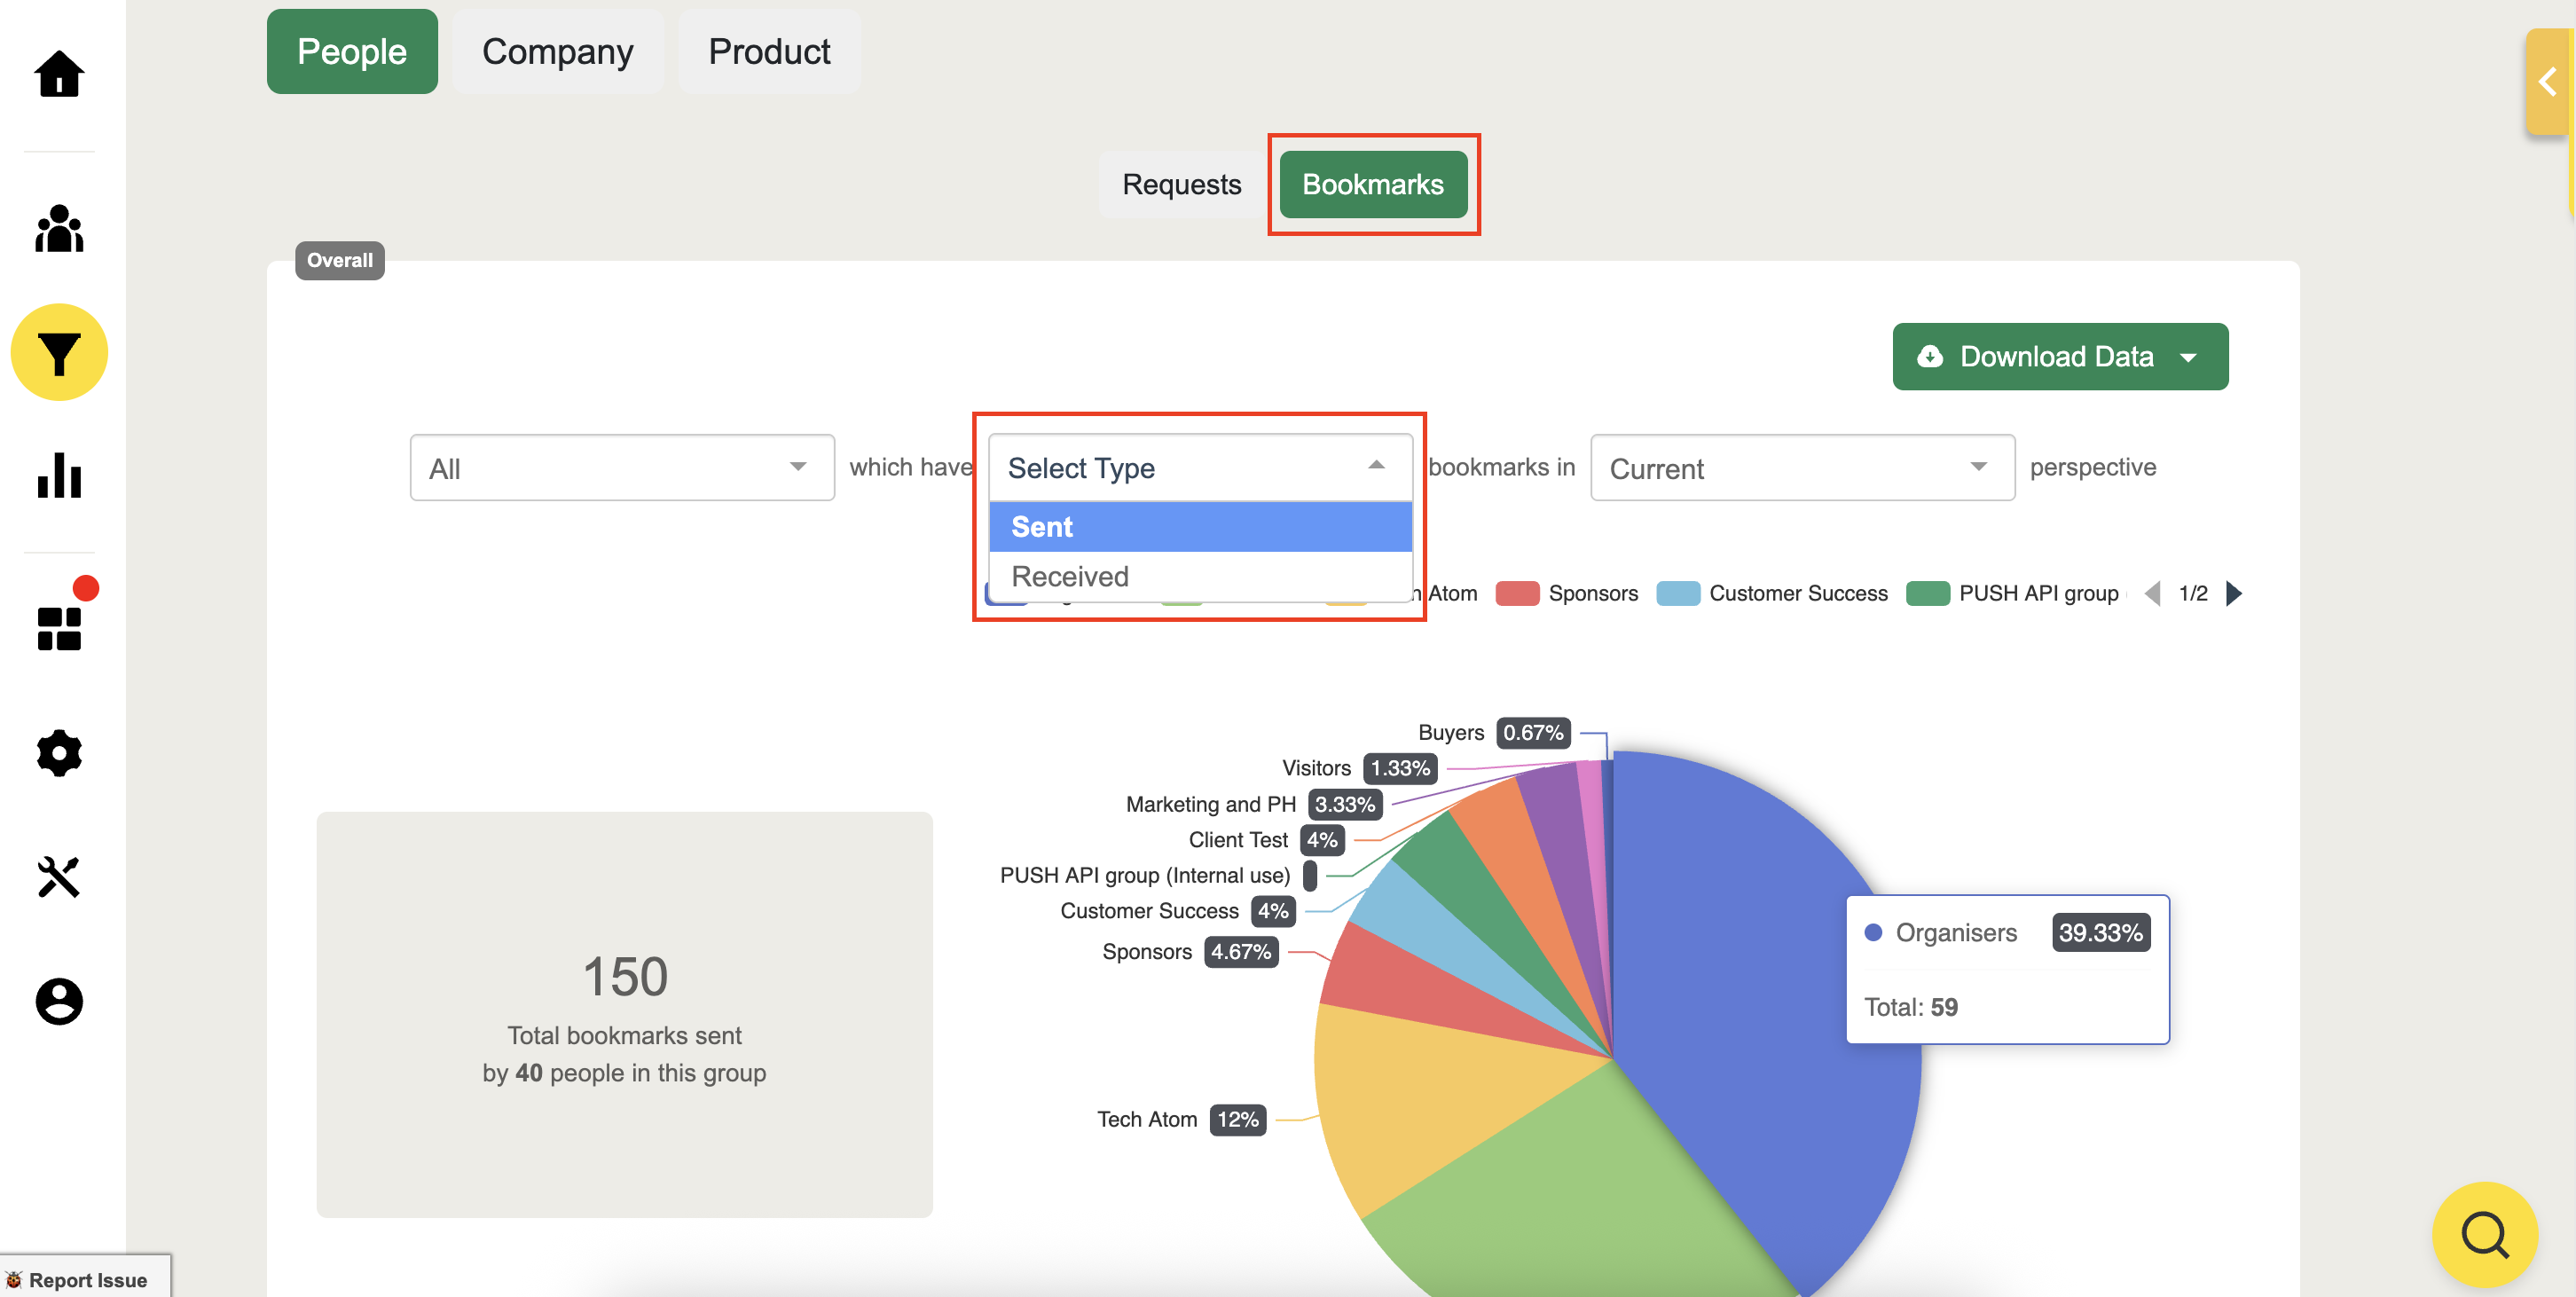
View bookmark filter by groups and their total Sent & Received bookmark count which people have received or sent to others.
Download the Bookmarks data which will be sent to your email in CSV format. All bookmarks will be showcased within the user’s profile on CRM.
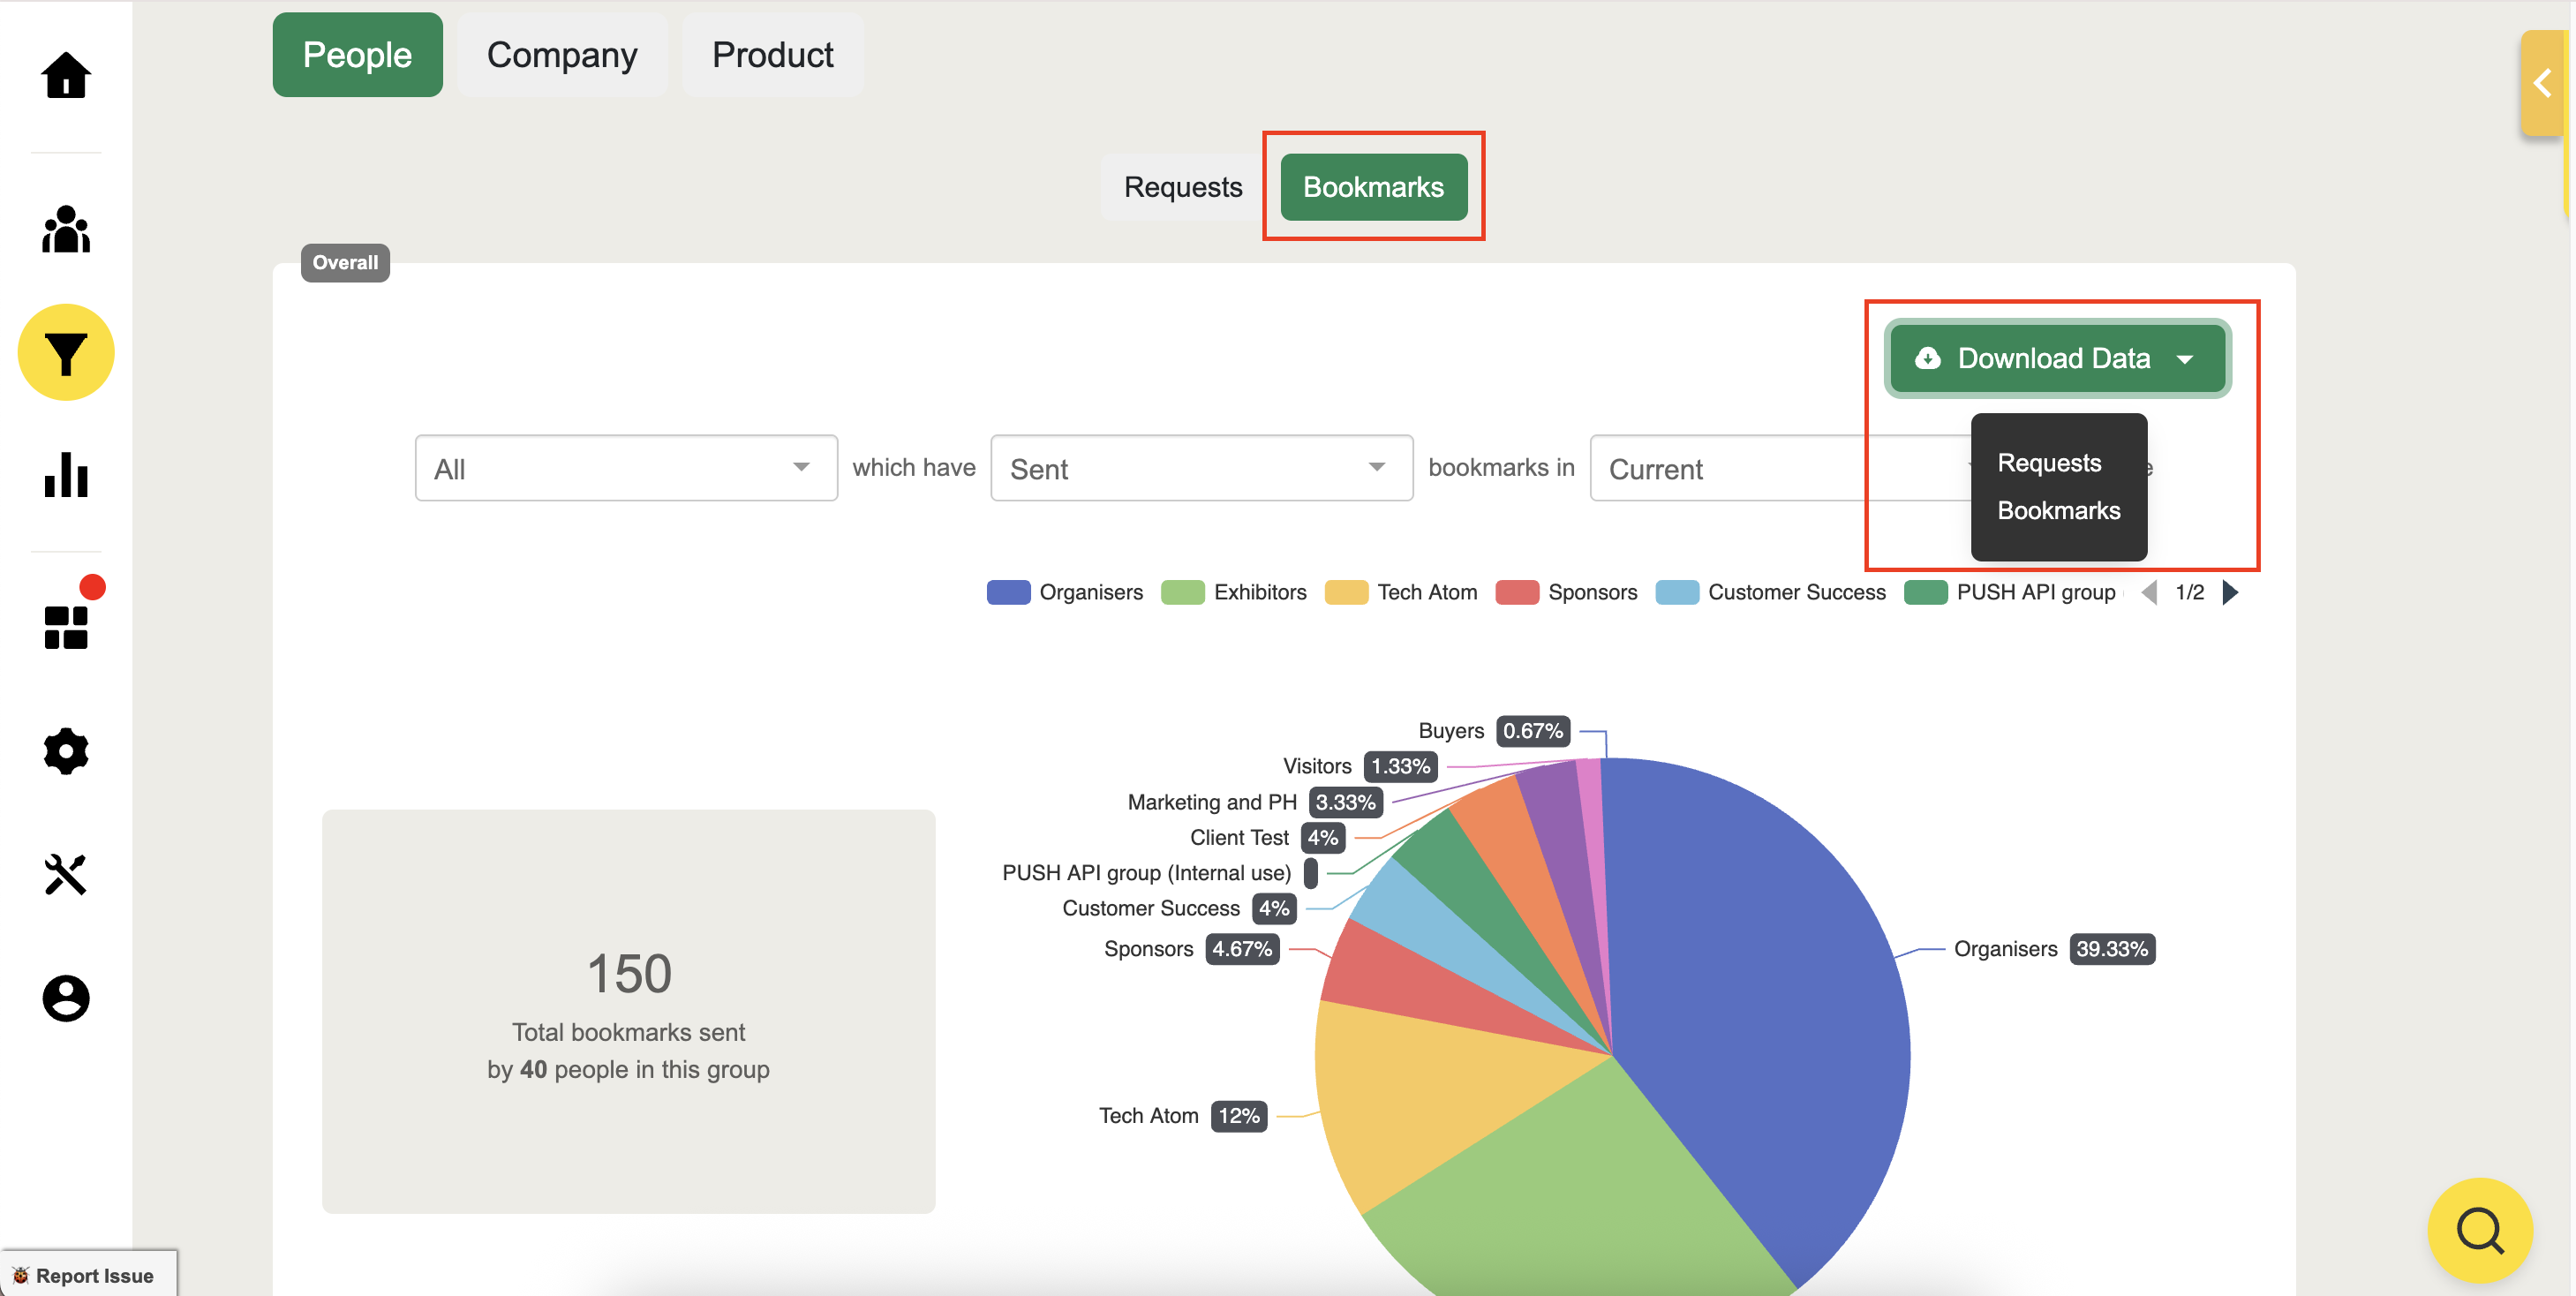
You can also filter per attribute and per group and include advanced filters to maximize your report data
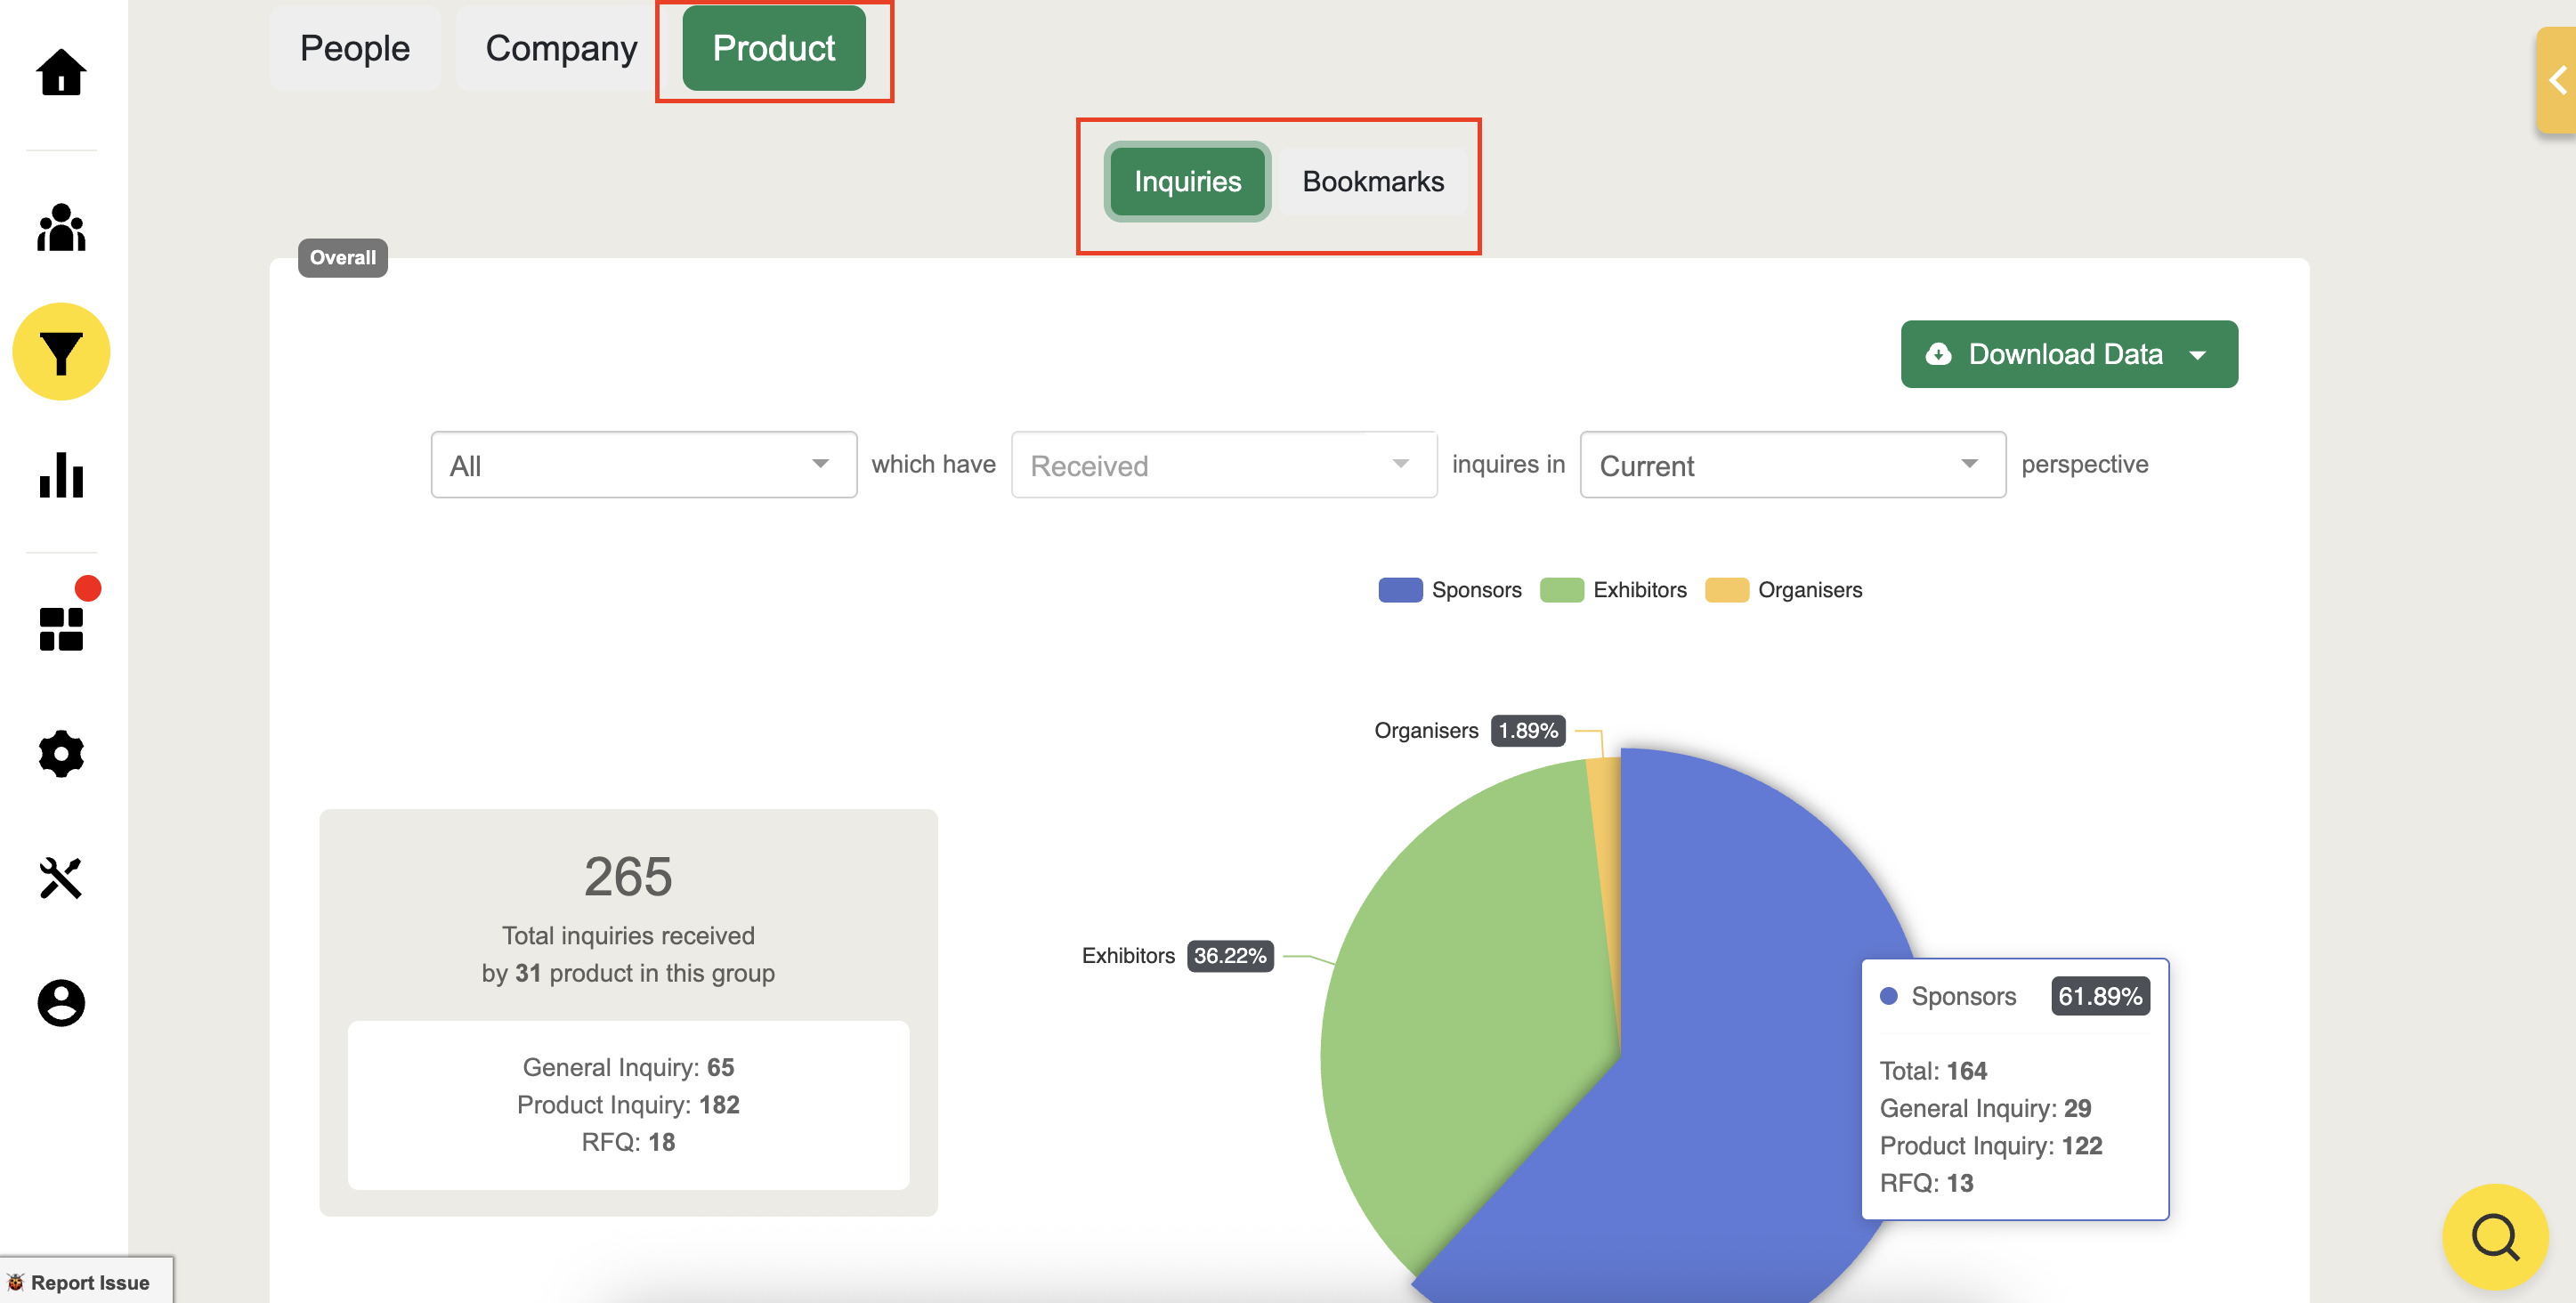
Product Inquiries and Bookmarks
Inquiries and Bookmarks Received
Hover over the pie chart to view the number of:
Total general and product inquiries, as well as RFQs
Product bookmarks
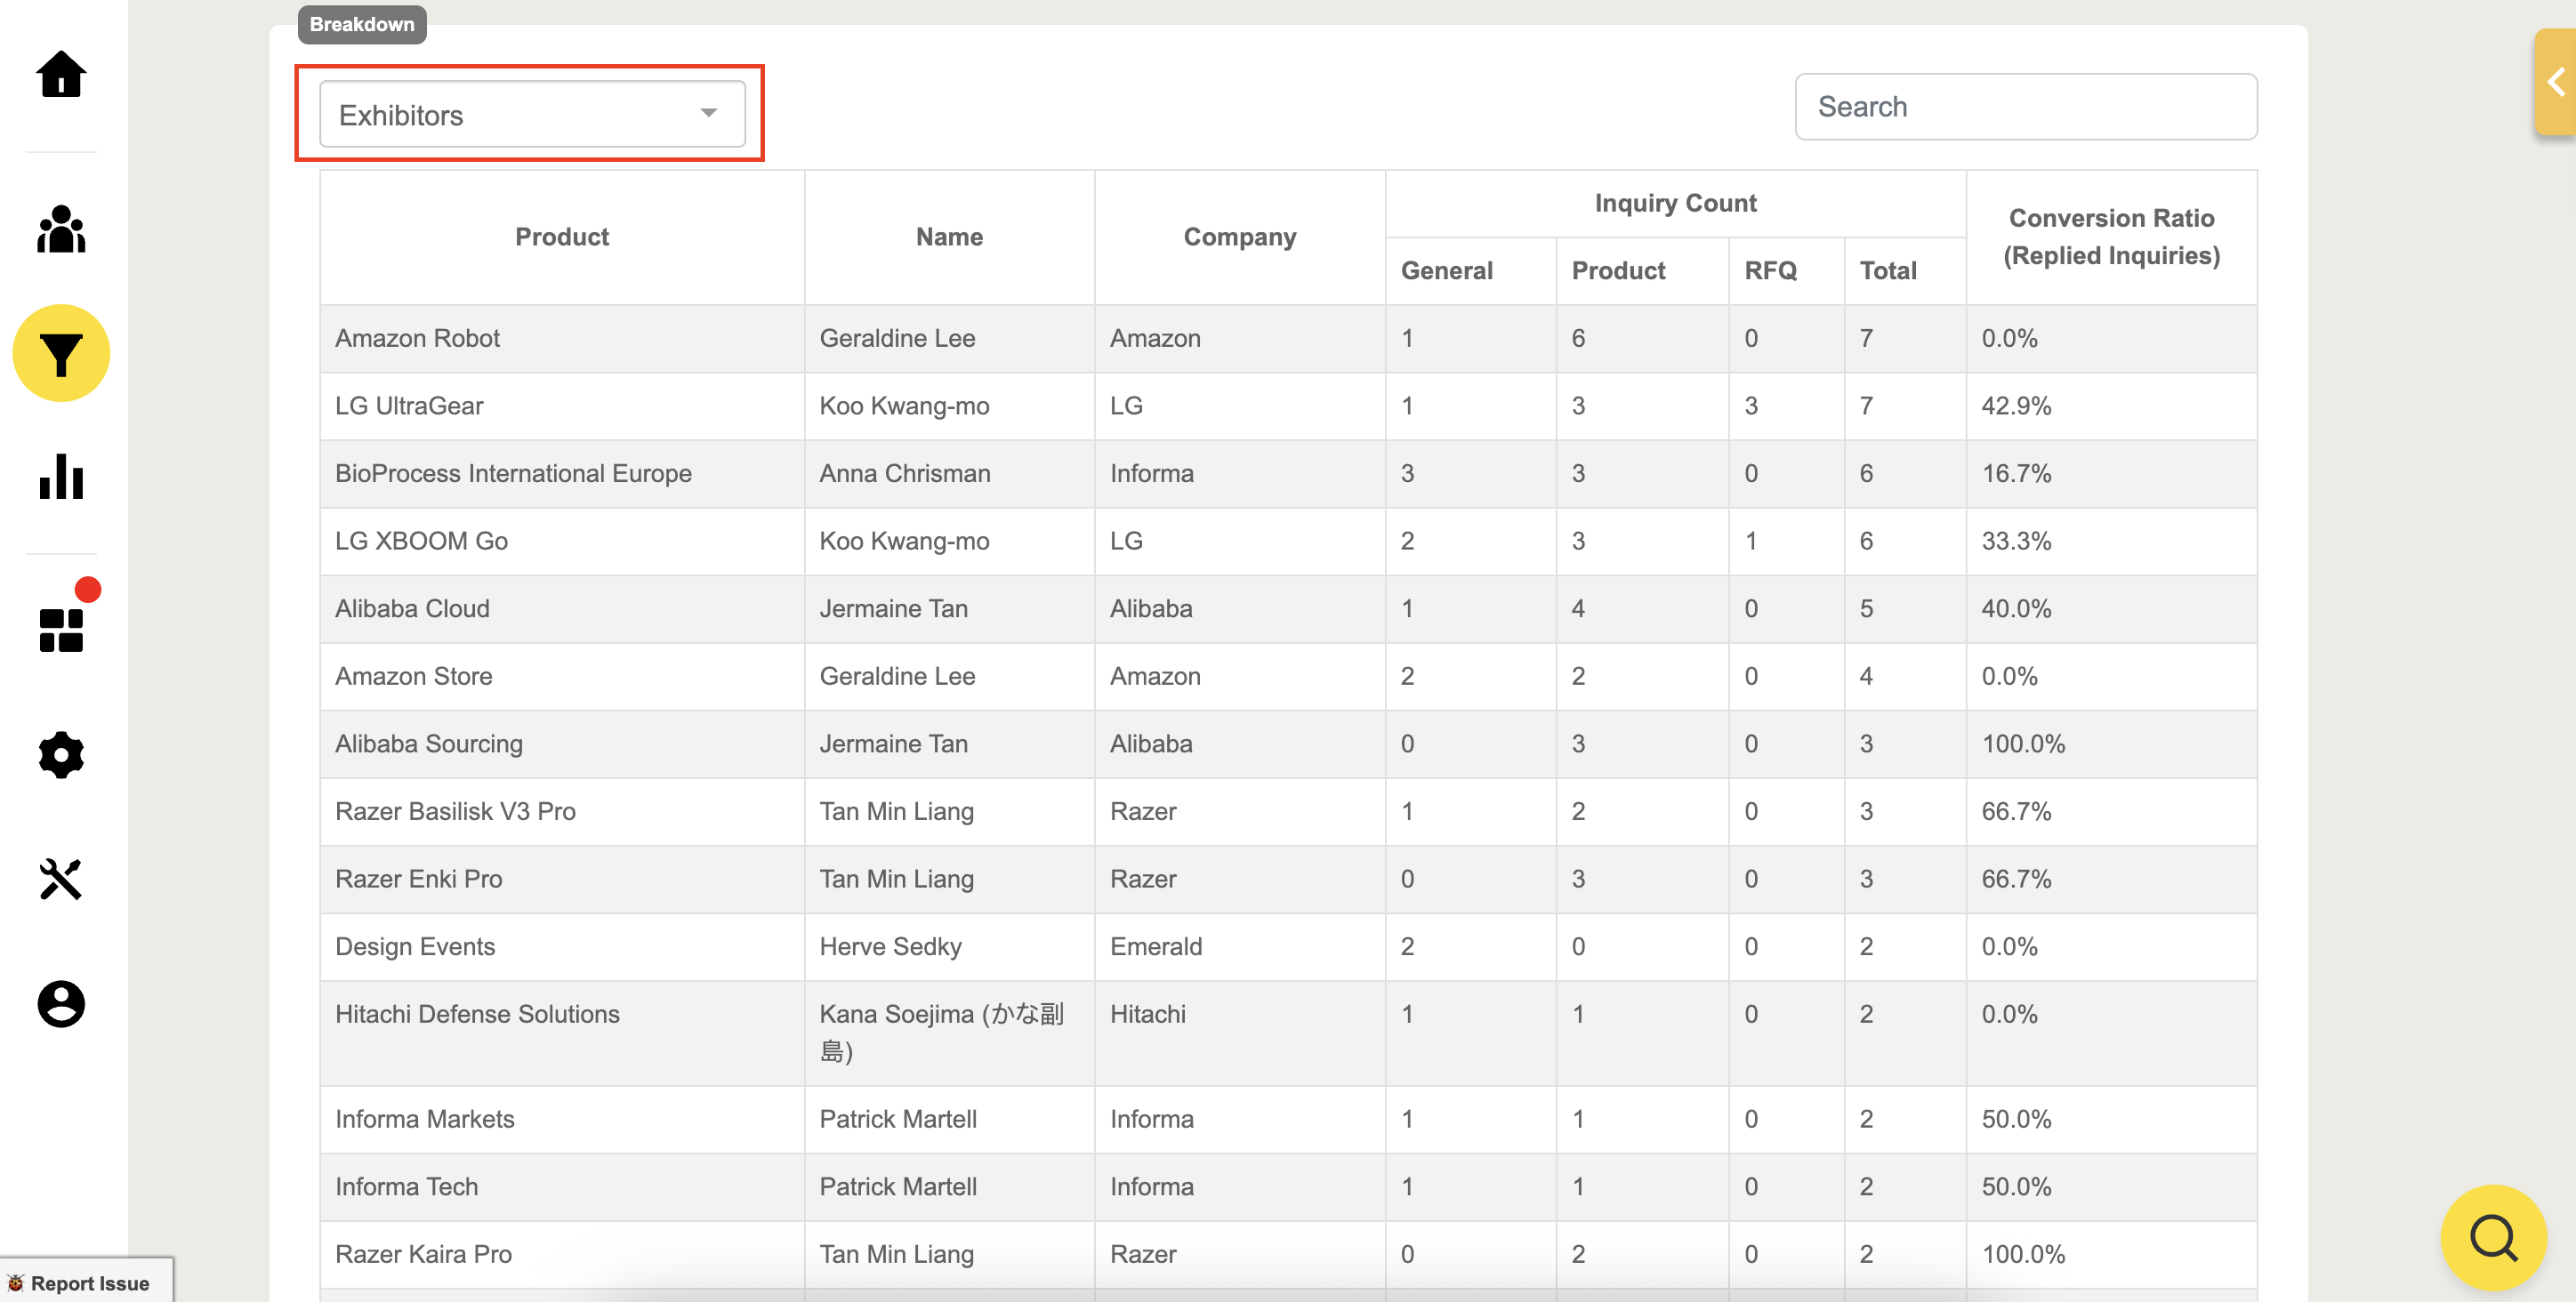
View product inquiries filtered by groups and their total Received inquiry count from attendees.
Download the inquiries or bookmarks data which will be sent to your email in CSV format. All bookmarks will be showcased within the user’s profile on CRM.
You can also filter per attribute and per group and include advanced filters to maximize your report data
If you want to read related information, here are some suggested reads: